  • Login
Cart
Exceljet logo Exceljet
  • Training
  • Videos
  • Functions
  • Formulas
  • Shortcuts
  • Articles
Cart
  • Login
  • Training
  • Videos
  • Functions
  • Formulas
  • Shortcuts
  • Articles
  • Login

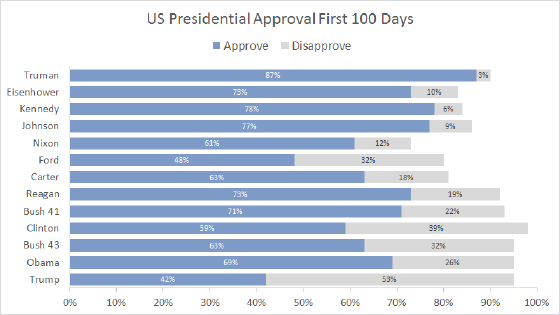
Excel Chart Examples

These real-world examples show how to use different Excel charts.

Quick Links

  • Chart types
  • Training
Plotting a line chart with thousands of data points
Line Chart

Line chart with many data points

Dynamic chart example - ignore empty values
Column chart

Dynamic chart ignore empty values

Column charting showing the effect of seasons on sunrise and sunset times
Stacked Column Chart

Daylight hours from sunrise to sunset

Example floating column chart, made with line chart + up down bars
Line Chart

Floating column chart with up down bars

Example 100% stacked column chart - project goal attainment
100% Stacked Column Chart

Project goal attainment

Example 100% stacked area chart - product mix over time
100% Stacked Area Chart

Product mix over time

Example stacked 100% bar chart - popular degrees for women
100% Stacked Bar Chart

Popular college degrees for women

Example bar chart - top 15 countries by life expectancy
Bar chart

Top 15 Countries by Life Expectancy

Example pie chart with ice cream flavor survey results
Pie Chart

Survey results favorite ice cream flavor

Example stacked column chart - quarterly sales by clustered region
Clustered Column Chart

Quarterly sales by clustered region

Example stacked column chart - quarterly sales by stacked region
Stacked Column Chart

Quarterly sales by stacked region

Combo chart example - income statement with annual data
Combo chart

Income statement annual data

Example clustered column chart comparing 4 products this year vs last
Clustered Column Chart

Products this year vs last year

Example clustered bar chart compare products this year vs last year
Clustered Bar Chart

Product mix this year vs last year

Example of line chart with actual and forecast
Line Chart

Line chart actual with forecast

Example Excel combo chart - daily sales versus ads
Combo chart

Column chart with target line

Excel XY scatter chart example - calculation of pi
Scatter Plot

Calculation of pi

US Heroin Overdose Deaths - Excel stacked area chart example
Stacked Area Chart

US Heroin Overdose Deaths

Excel stacked bar chart - Trump approval first 100 days
Stacked Bar Chart

Trump approval first 100 days

Cover art for 101 Excel Functions You Should Know

Download 100+ Important Excel Functions

Get PDF Guide

You are the best! Exceljet is my first stop to find quick specific answers to my excel questions and get my spreadsheets back up and running! Thank you!
Marisa
More Testimonials

Get Training

Quick, clean, and to the point training

Learn Excel with high quality video training. Our videos are quick, clean, and to the point, so you can learn Excel in less time, and easily review key topics when needed. Each video comes with its own practice worksheet.

View Paid Training & Bundles
Excel foundational video course
Excel Pivot Table video training course
Excel formulas and functions video training course
Excel Charts video training course
Video training for Excel Tables
Dynamic Array Formulas
Exceljet logo Exceljet
Quick, clean, and to the point

Resources

  • Training
  • Videos
  • Functions
  • Formulas
  • Shortcuts
  • Articles

About Us

  • About
  • Testimonials
  • Topics
  • Contact
  • Donate

Newsletter Sign-up

Work faster in Excel. Join more than 100,000 people who get weekly tips from us.
© 2012-2025 Exceljet. Terms of use
  • Visit our Twitter page