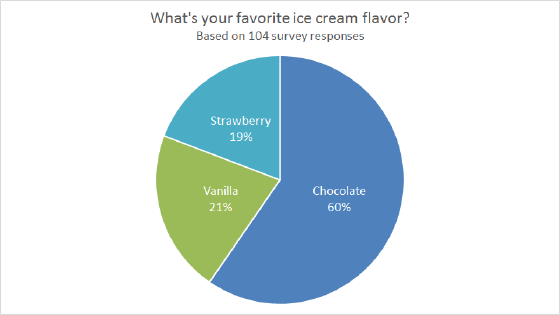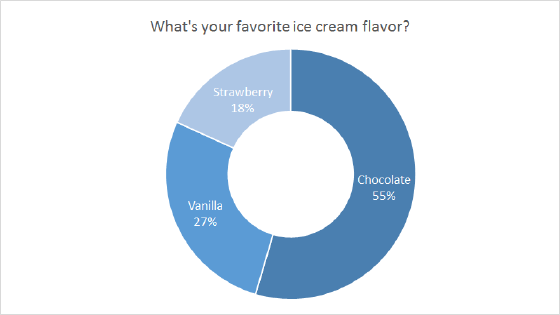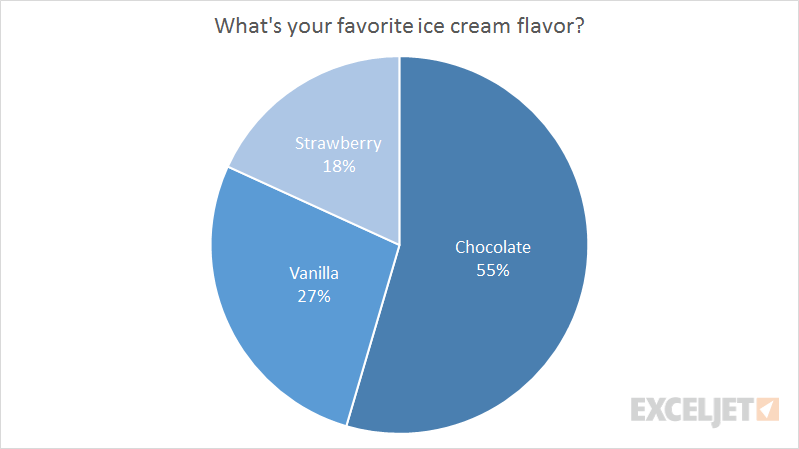
The Pie Chart is a primary chart type in Excel. Pie charts are meant to express a "part to whole" relationship, where all pieces together represent 100%. Pie charts work best to display data with a small number of categories (2-5). For example, survey questions in yes/no format, data split by gender (male/female), new and returning visitors to a website, etc.
Pie charts should be avoided when there are many categories, or when categories do not total 100%. The human eye has trouble comparing the relative size of slices in a pie chart, so pie charts should also be avoided when slices are similar, unless similarity is the point.
Pros
- Simple, compact presentation
- Can be read "at a glance" with limited categories
- Excel can calculate % values automatically
Cons
- Difficult to compare relative size of slices
- Become cluttered and dense as categories are added
- Limited to part-to-whole data
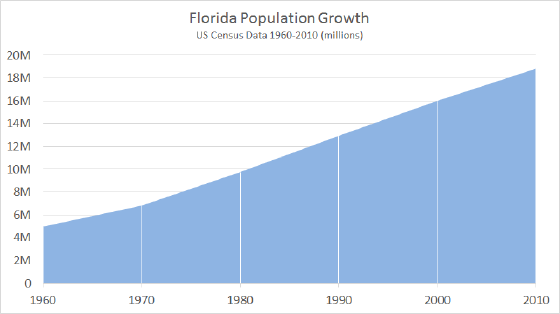
- Poor at showing change over time
Tips
- Limit categories
- Avoid all 3d variants
See also: Dataviz expert Ann Emery's Pie Chart Guidelines.