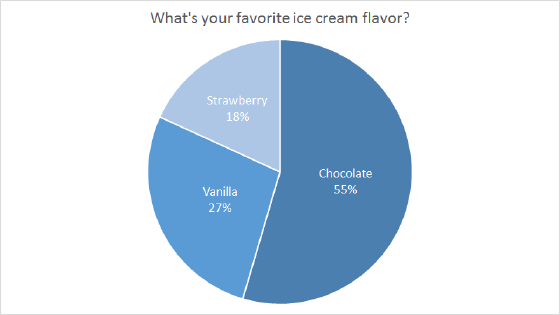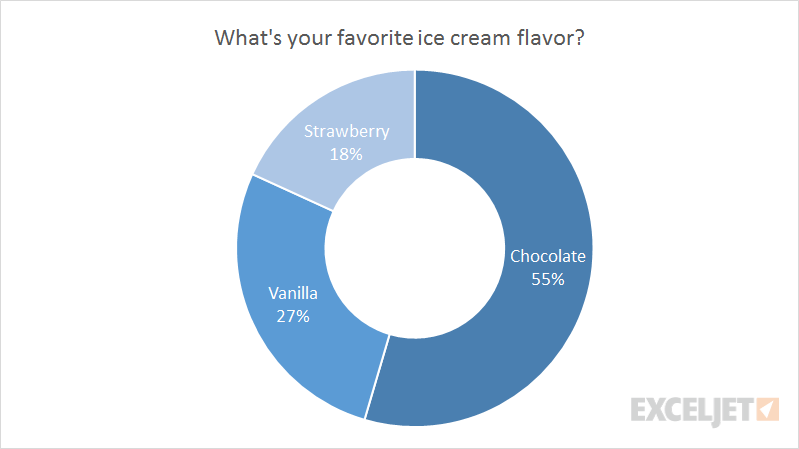
The Doughnut Chart is a built-in chart type in Excel. Doughnut charts are meant to express a "part-to-whole" relationship, where all pieces together represent 100%. Doughnut charts work best to display data with a small number of categories (2-5). For example, you could use a doughnut chart to plot survey questions with a small number of answers, data split by gender, Windows vs. Mac users, or other data where categories are limited.
Doughnut charts should be avoided when there are many categories, or when categories do not sum to 100%.
Pros
- Simple, compact presentation
- Can be read "at a glance"
- Excel will calculate percentages automatically
Cons
- Difficult to compare relative size of slices
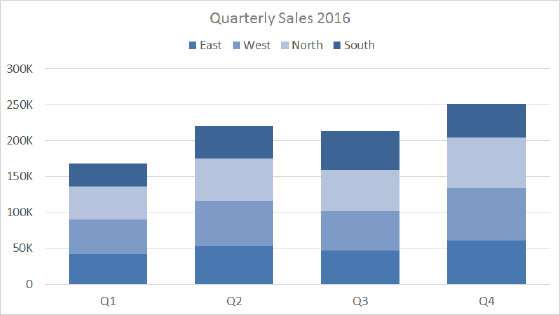
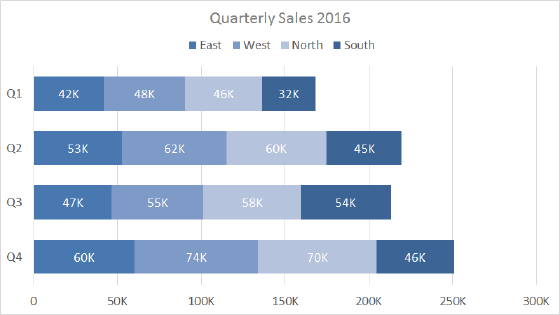
- Become cluttered and dense as categories are added
- Limited to part-to-whole data
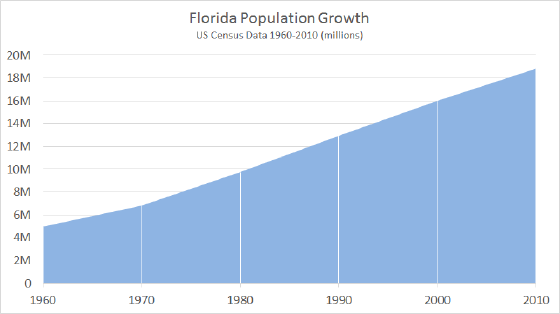
- Poor at showing change over time
Tips
- Limit categories
- Consider other charts to show change over time