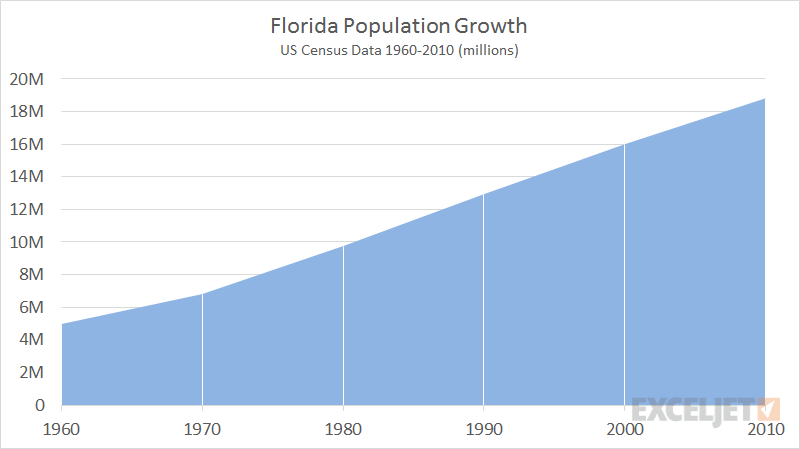
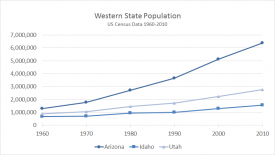
An area chart is a primary Excel chart type, with data series plotted using lines with a filled area below. Area charts are a good way to show change over time with one data series. They offer a simple presentation that is easy to interpret at a glance.
Pros
- Simple presentation; easy to read and create
- Good for showing trends over periods of time
- Can handle positive and negative values
Cons
- Don't usually work well for multiple data series
- Line can imply more data than actually available (compared to bar or column chart)


