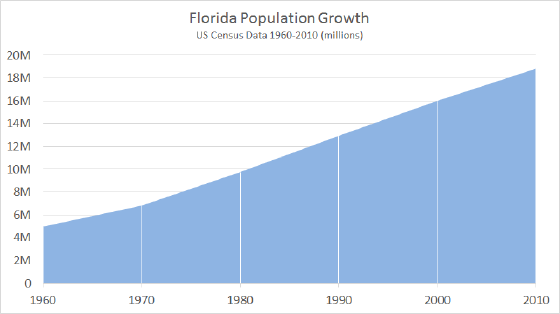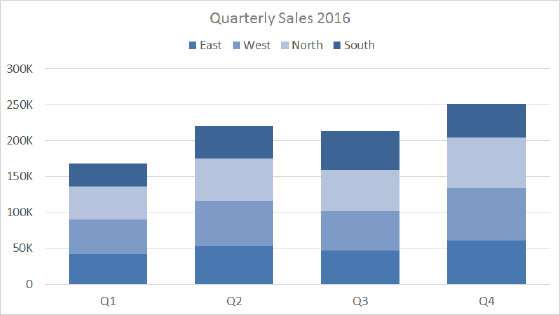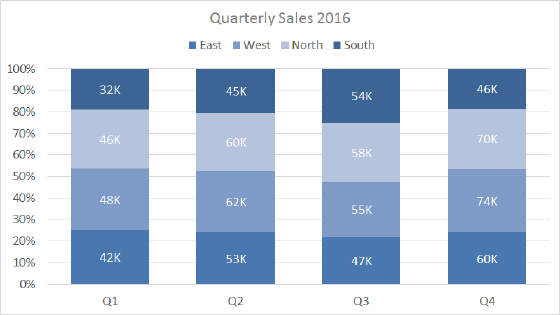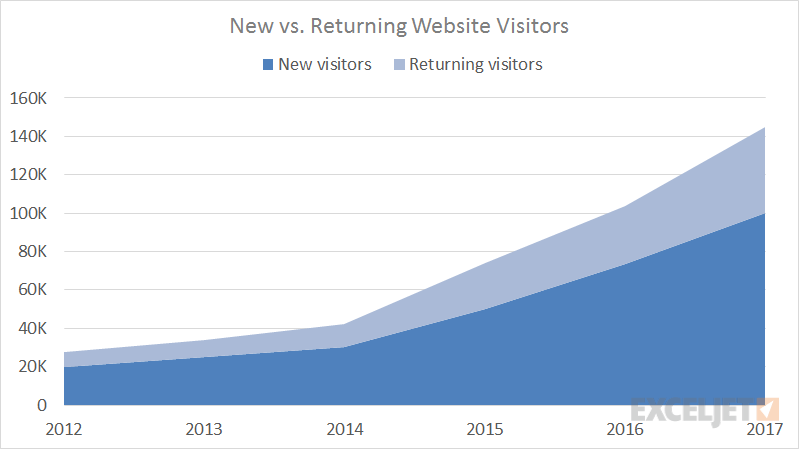
A stacked area chart is a primary Excel chart type that shows data series plotted with filled areas stacked, one on top of the other. A stacked area chart can show how part to whole relationships change over time. They offer a simple presentation that is easy to interpret at a glance.
Pros
- Simple presentation can be red at a glance
- Can show part to whole changes over time
Cons
- Generally harder to add data labels since there is less white space available
- Area charts can imply more data than actually available