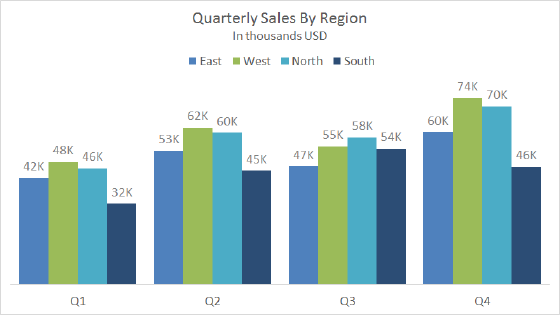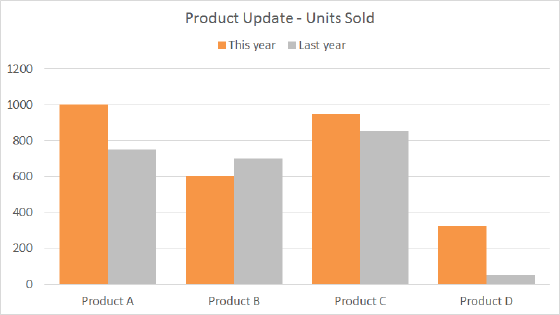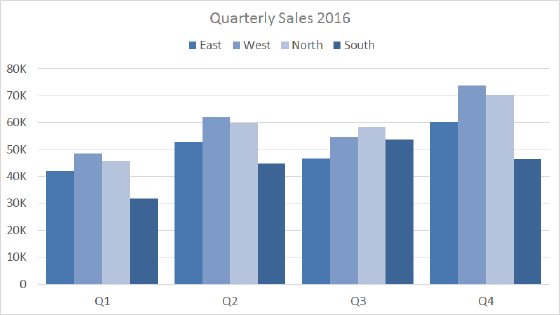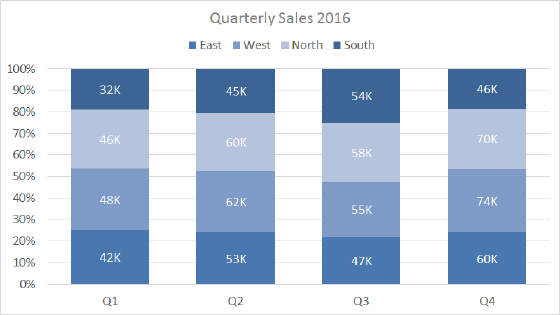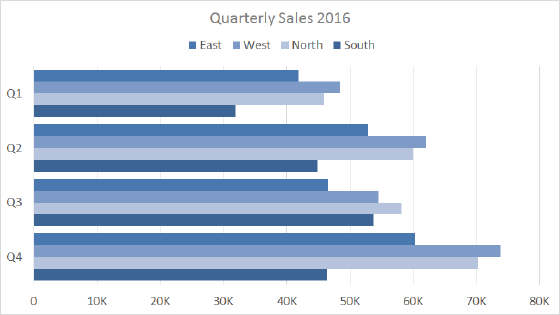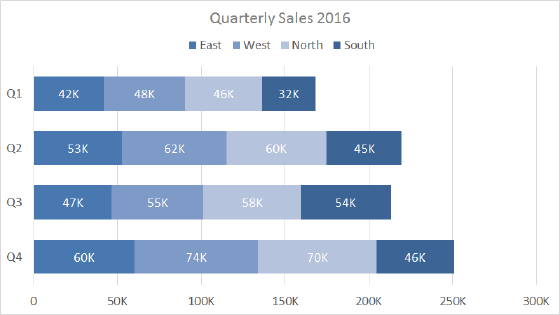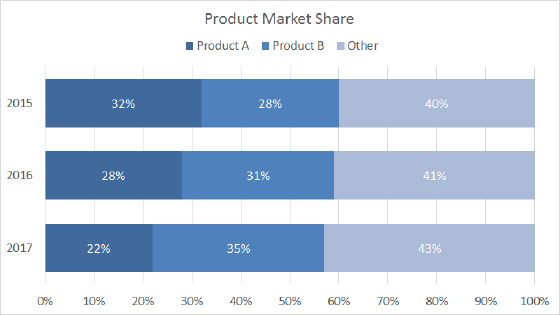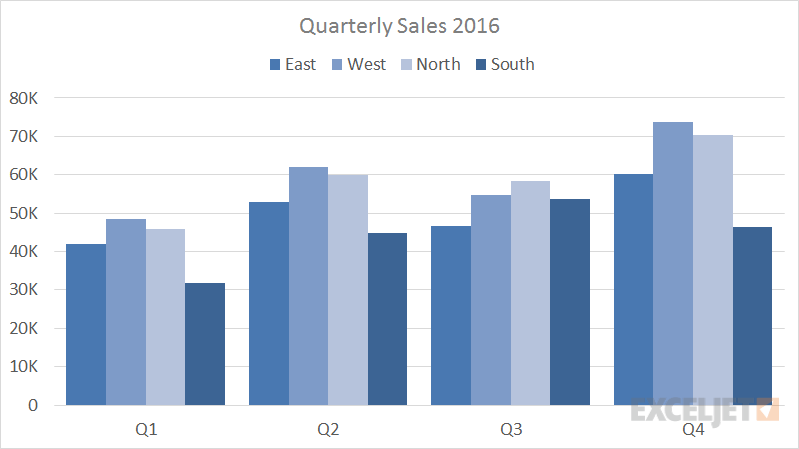
A clustered column chart displays more than one data series in clustered vertical columns. Each data series shares the same axis labels, so vertical bars are grouped by category. Clustered columns allow the direct comparison of multiple series, but they become visually complex quickly. They work best in situations where data points are limited.
Pros
- Allow direct comparison of multiple data series per category
- Can show change over time
Cons
- More difficult to compare a single series across categories
- Become visually complex as categories or series are added
Tips
- Limit data series and categories
- Avoid all 3d variants