=FREQUENCY(data_array, bins_array)- data_array - An array of values for which you want to get frequencies.
- bins_array - An array of intervals ("bins") for grouping values.
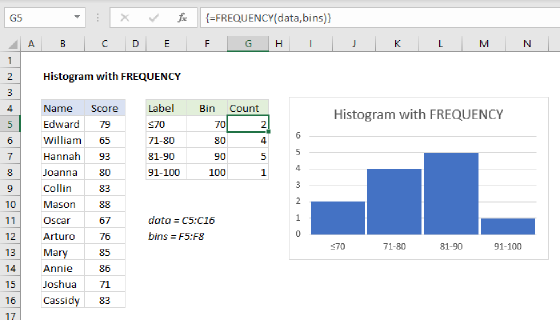
Using the FREQUENCY function
The FREQUENCY function counts how often numeric values occur in a set of data and returns a frequency distribution – a list that shows the frequency (count) of each value in a range at given intervals (bins). FREQUENCY returns the distribution as a vertical array of numbers that represent a "count per bin".
The FREQUENCY function always returns an array with one more item than bins in the bins_array. This is by design, to catch any values greater than the largest value in the bins_array. The general pattern for FREQUENCY is:
=FREQUENCY(data,bins)
where data_array and bins_array are typically ranges on the worksheet.
Instructions
To create a frequency distribution using FREQUENCY:
- Enter numbers that represent the bins you want to group values into
- Make a selection the same size as the range that contains bins, or one greater if want to include the extra item
- Enter the FREQUENCY function as a multi-cell array formula with control+shift+enter.
In Excel 365, it is not necessary to enter FREQUENCY as an array formula. See notes below.
Examples
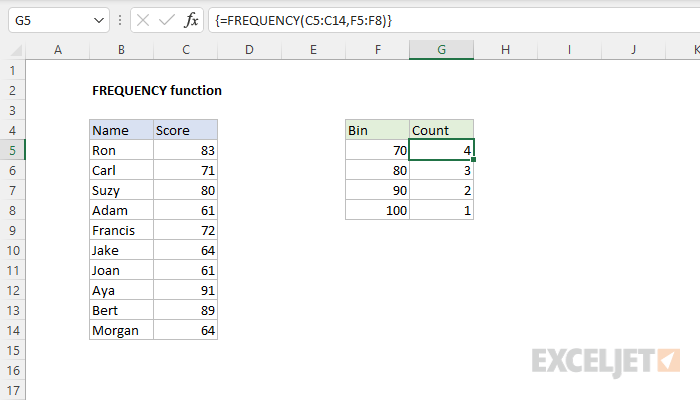
In the example shown, the formula in G5:G8 is:
{=FREQUENCY(C5:C14,F5:F8)}
Entered as a multi-cell array formula.
Note: the curly braces added by Excel automatically when entered with control + shift + enter.
Horizontal results
The FREQUENCY function always returns a vertical array of results. To return horizontal results, wrap the FREQUENCY function in the TRANSPOSE function:
=TRANSPOSE(FREQUENCY(data,bins))
Excel 365
In Excel 365, which supports dynamic arrays natively, it is not necessary to select multiple cells before entering the FREQUENCY function. In cell G5, you can simply enter the formula below:
=FREQUENCY(C5:C14,L5:L8)
FREQUENCY will return an array of six counts, and these counts will spill automatically into the range G5:G9. The count in the last row (G9) is the overflow bin, the count of any values greater than the largest value in the bins_array.
Notes
- FREQUENCY returns multiple values and must be entered as an array formula, except in Excel 365.
- FREQUENCY always returns an array with one more item than bins. This is by design, to catch any values greater than the largest interval in the bins_array.
- Each bin shows a count of values up to and including bin value, excluding values already accounted for.