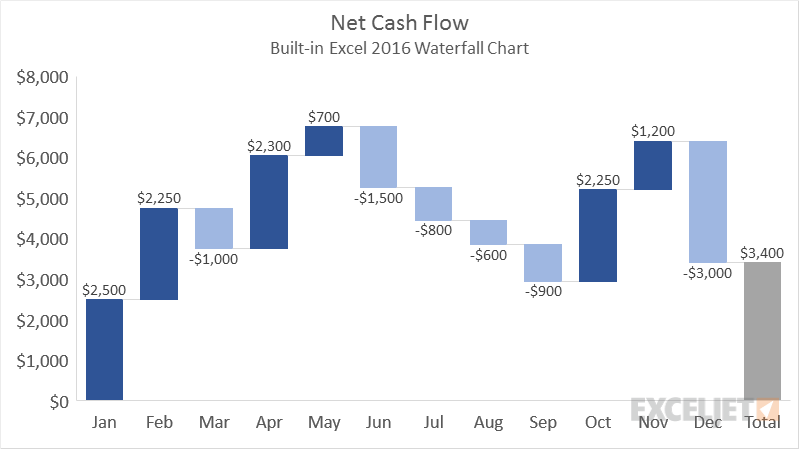
The Waterfall Chart is a built-in chart type in Excel 2016+. Waterfall charts are used to plot the cumulative result of values as a visual running total. The initial and final values sit directly on the horizontal axis and intermediate values are plotted as floating columns - positive values extend upward, and negative values extend downward. The effect is a staircase like display is useful for showing how an initial value is affected by subsequent positive and negative changes. Waterfall charts are sometimes called bridge charts.
Pros
- Simple to create in Excel 2016+
- At-a-glance visual display of positive and negative changes
Cons
- Less common chart type not as familiar to many people
- Built-in waterfall chart type has limited options