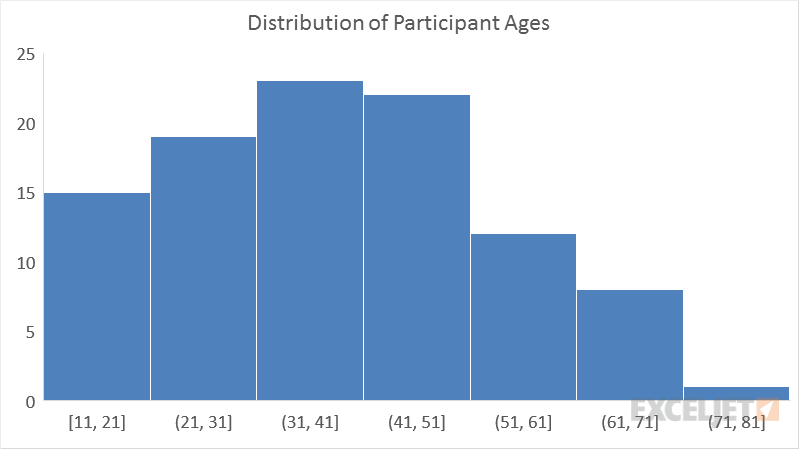
A histogram is a visual representation of the distribution of numerical data. It is a special kind of bar graph where bars represent "bins" that group together values at specific intervals. The height of each bar shows the proportion of values in that bin. Typically, there are no gaps between bins to represent continuous data.
In Excel 2016+, a histogram is built-in chart type.
Pros
- Simple to create in Excel 2016+
- At-a-glance visualization of the distribution of numerical data
Cons
- Less common chart type not as familiar to many people
- Built-in histogram chart type has limited options