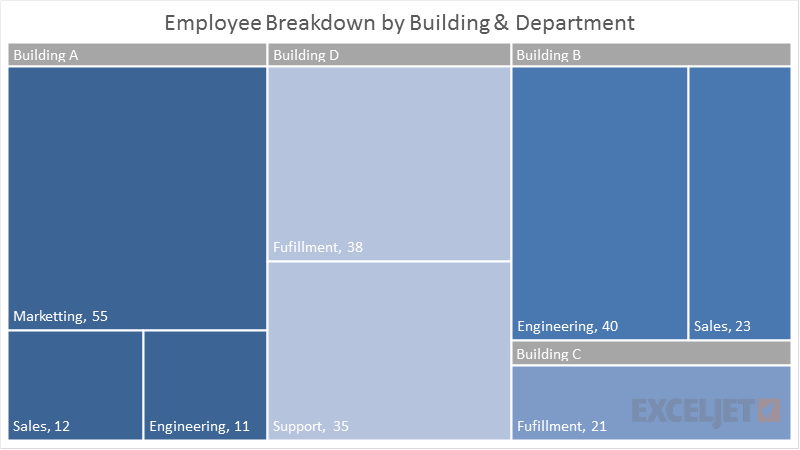
The Treemap chart is a built-in chart type in Excel 2016+. A treemap chart displays hierarchical data in rectangles proportionally sized according to the amount of data in each category. Treemap charts are lacking many of the controls available in other chart types, but they are an interesting way to quickly visualize certain kinds of data.
Pros
- Quick visualization of hierarchical data
- At-a-glance breakdown data in categories
Cons
- Data must be sorted by category
- Missing many of the options available in other chart types