=PERCENTRANK.INC(array, x, [significance])- array - Array of data values.
- x - Value to rank.
- significance - [optional] Number of significant digits in result. Defaults to 3.
Using the PERCENTRANK.INC function
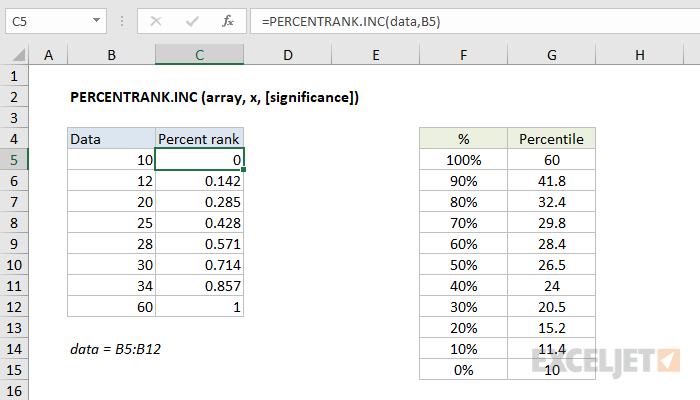
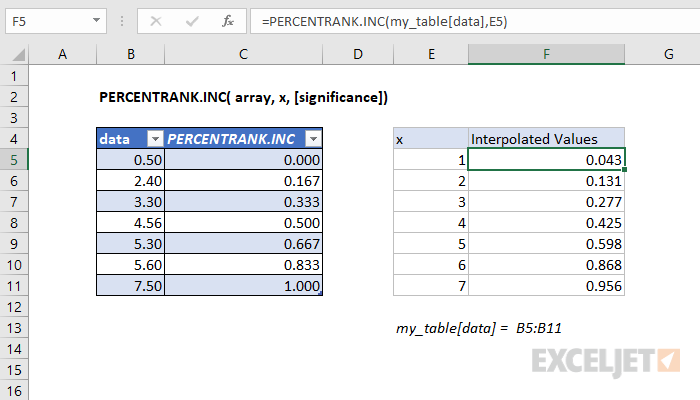
The Excel PERCENTRANK.INC returns the relative standing of a value within a data set as a percentage. For example, a test score greater than or equal to 80% of all test scores is said to be at the 80th percentile. In this case, PERCENTRANK.INC will assign a rank of .80 to the score. In the example shown, the formula in C5 is:
=PERCENTRANK.INC(data,B5)
where "data" is the named range C5:C12.
Note: The PERCENTRANK.INC function replaces PERCENTRANK, which is now classified as a "compatibility function".
Interpolation
When x does not exist within the array, the function interpolates a value between data points. For example, when the x value of 4.00 is passed as an argument to the function, the percentage is interpolated to 42.4%, which lies between the percent ranks of 3.3 and 4.56, which are 33.3% and 50.0%, respectively.
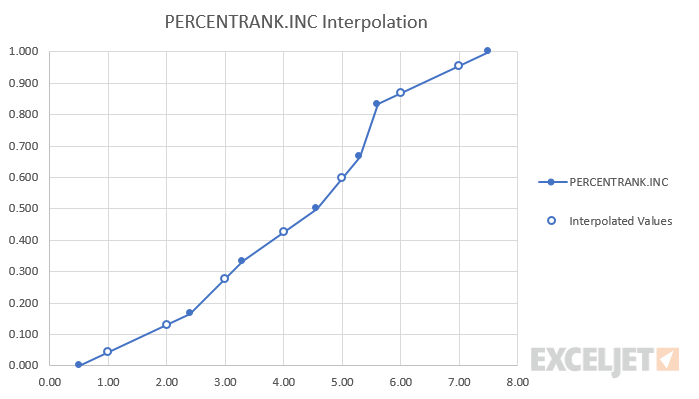
In the graph below, solid blue dots represent x values contained within the input array, while the outlined blue dots represent interpolated values.
Inclusive vs. Exclusive
Starting with Excel 2010, the PERCENTRANK function has been replaced by two distinct functions: PERCENTRANK.INC and PERCENTRANK.EXC. Both functions use the same arguments, but they differ in how they handle the boundaries of the dataset:
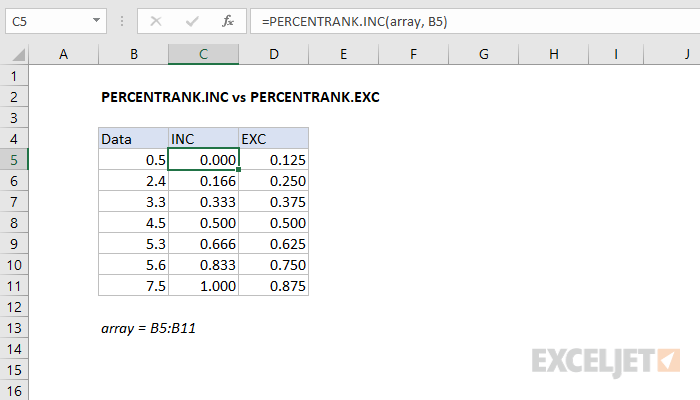
- PERCENTRANK.INC (Inclusive): Calculates the percentage rank of a value within the full range of the dataset, including the first and last values. The output is within the range [0,1], inclusive of the endpoints.
- PERCENTRANK.EXC (Exclusive): Calculates the percentage rank in a slightly different way by conceptually adding two virtual values—one smaller than the smallest actual value and one larger than the largest actual value. As a result, the percentage rank of the smallest value will be slightly above 0, and the rank of the largest value will be slightly below 1. The output falls within the range (0,1), exclusive of the endpoints.
The screen below shows differences with a small data set:
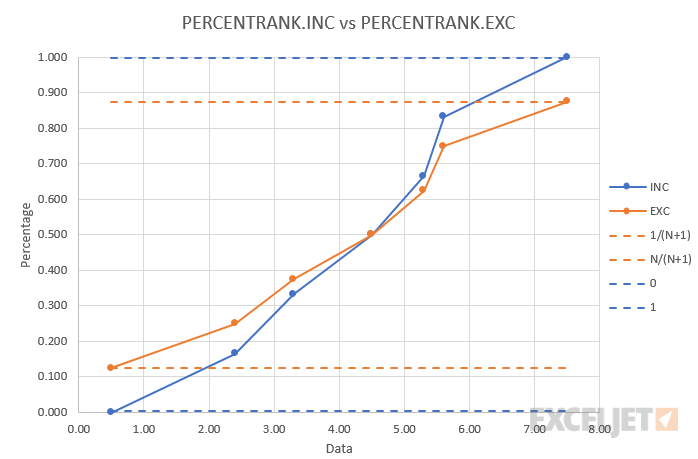
As the size of the input array increases, the difference between the two functions decreases. The difference between the returned percentages will never be larger than 1/(N+1), where N is the size of the input array.
Notes
- If x does not exist in the array, PERCENTRANK.INC interpolates to find the percentage rank.
- When significance is omitted PERCENTRANK.INC returns three significant digits (0.xxx)