=PERCENTOF(data_subset, all_data)- data_subset - A subset of data as a range or array.
- all_data - All data as a range or array.
Using the PERCENTOF function
The PERCENTOF function is designed to return a subset of data as a percentage of a larger data set. The output from PERCENTOF is a decimal number that can be formatted with Excel's percentage number format. Essentially, PERCENTOF performs a calculation like this:
=SUM(data_subset)/SUM(data_all)
The result will be a decimal number that must be formatted as a percentage. For example, if the subset of data is 250 and the full set of data is 1000, PERCENTOF will return 0.25:
=PERCENTOF(250,1000) // returns 0.25
When 0.25 is formatted as a percentage, it will display as 25% on the worksheet.
Worksheet Example
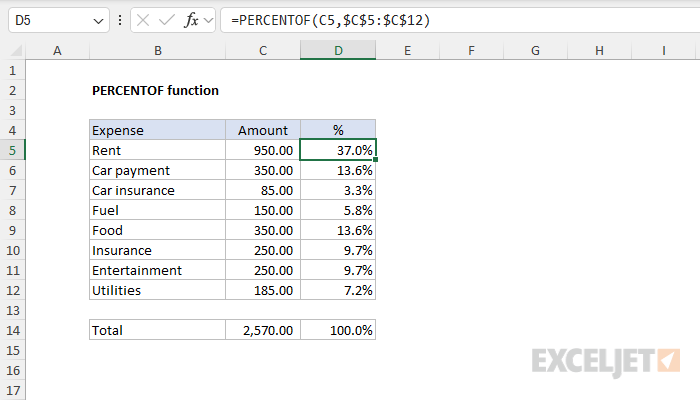
In the worksheet shown above, the formula in cell D5 looks like this:
=PERCENTOF(C5,$C$5:$C$12)
The result is 37% (0.37) since $950 is 37% of the sum of the range C5:C12, which is $2570. As the formula is copied down, it returns each value in column C5:C12 as a percentage of $2570.
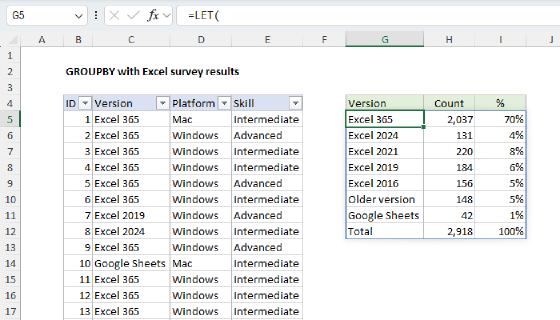
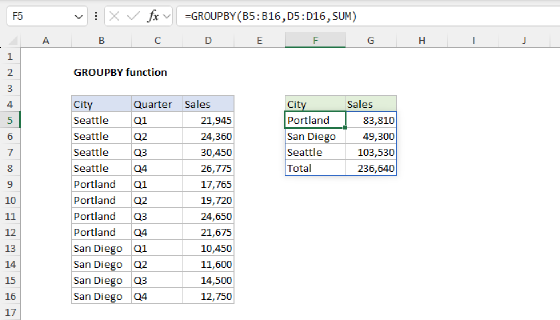
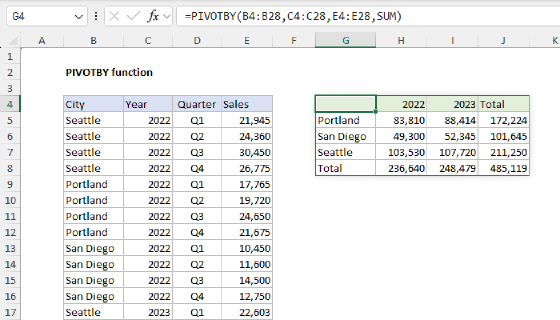
Although PERCENTOF will work fine on its own, it was originally introduced as a companion to the GROUPBY and PIVOTBY functions to provide a simple way to show data subsets as percentages in the output of these functions.