Explanation
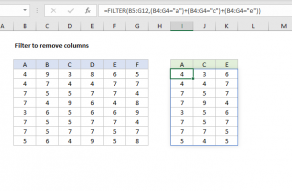
Although FILTER is commonly used to filter rows, you can also filter columns. The trick is to use an include argument that operates on columns instead of rows. In this example, we use a hard-coded array constant to filter out unwanted columns, but you can also use a logical expression that returns the same kind of array in a dynamic way. Note: the named range data is used for convenience only; a regular range reference will also work fine.
Working from the inside out, the FILTER function is used to filter out the middle column, "Qty", like this:
FILTER(data,{1,0,1}) // remove middle column
The array constant {1,0,1} is what does the actual filtering, and notice this is a horizontal array, separated by commas. The result from FILTER is a two-dimensional array with 2 columns and 11 rows like this:
{"Red","East";
"Blue","South";
"Green","North";
"Red","North";
"Blue","East";
"Green","North";
"Red","North";
"Blue","South";
"Green","North";
"Red","North";
"Blue","East"}
Notice data in the "Qty" column has been removed. This array is delivered to the UNIQUE function, which can automatically extract unique values from data with adjacent columns. The UNIQUE function returns a smaller two-dimensional array with 2 columns and 5 rows like this:
{"Red","East";
"Blue","South";
"Green","North";
"Red","North";
"Blue","East"}
Notice this array contains only the unique combinations of Color and Region. This smaller array is then handed off to the SORT function, which returns the same data, sorted by Color, as seen in the example. The SORT function is optional and can be removed.
This is a nice example of nesting one function inside another. When you see a formula created this way, learn to read from the inside out. The inner functions deliver values to the outer functions. The outermost function returns the final result.

