Summary
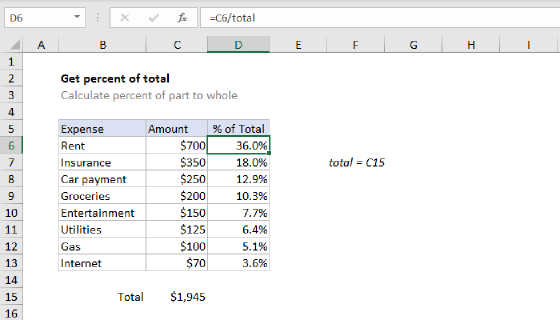
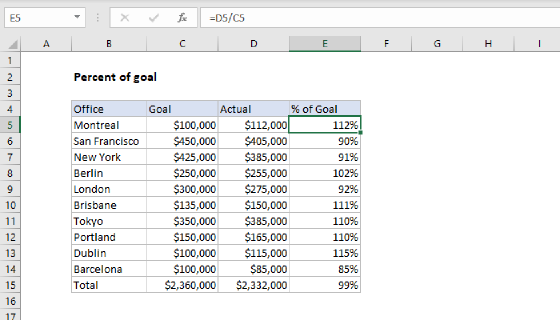
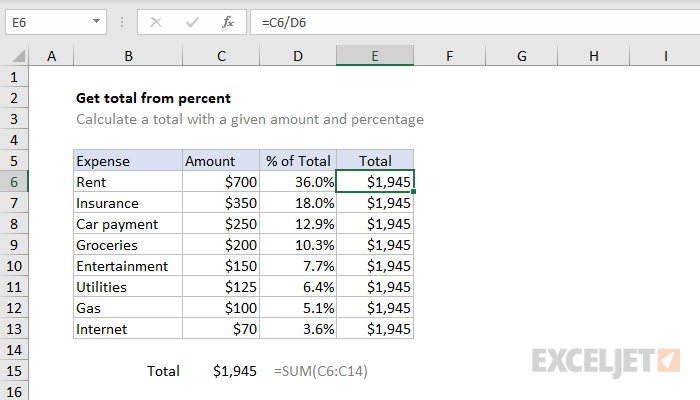
To calculate a total when you know the amount and percentage of one part of the total, you can use a formula that simply divides the amount by the percentage. In the example shown, the formula in E6, copied down, is:
=C6/D6
Generic formula
=amount/percentage
Explanation
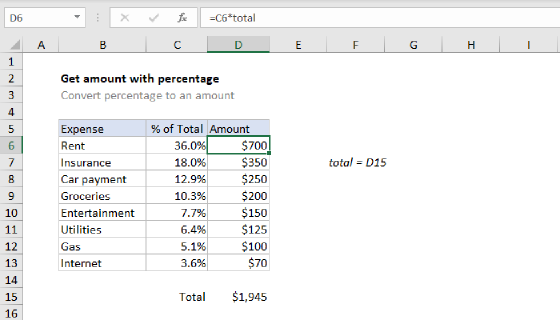
In this example, the goal is to work out the total of all expenses using a known percent of total of any one expense. If we know groceries are $200 and we know groceries represent 10.3% of total expenses, we want to calculate the total of all expenses ($1945). In other words, $200 is 10.3% of what number? With "x" as the number we want to find, we have:
25%*x=200
0.25*x=200
x=200/0.25
x=1945
So, to perform this calculation in Excel, we need to divide the amount of the expense in column C by the percentage that expense represents in column D like this:
=amount/percentage
In the example, the active cell E6, copied down, is:
=C6/D6
Excel simply divides the value in cell C6 by the percentage value in cell D6:
=700/0.359897 // returns 1945
The result is the number 1945 , which is the total of all expenses in this case. As the formula is copied down the table, the result is the same at each new row, since total for all expenses remains the same.
The formula in cell C15 uses the SUM function to check the results in column E:
=SUM(C6:C14) // returns 1945
Formatting percentages in Excel
In mathematics, a percentage is a number expressed as a fraction of 100. For example, 85% is read as "Eighty-five percent" and is equivalent to 85/100 or 0.85. Accordingly, the values in column D are decimal values. For example, D6 is approximately 0.36, D7 is approximately 0.18, etc.
To format a number like this as a percentage with the percent sign (%), apply the Percentage number format.