Summary
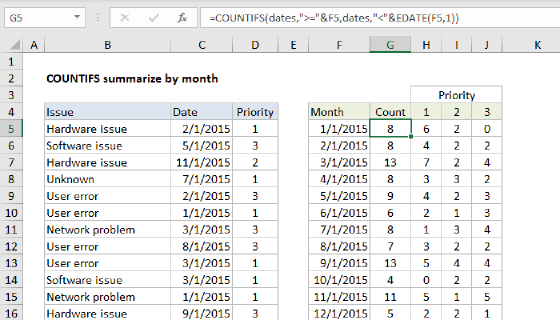
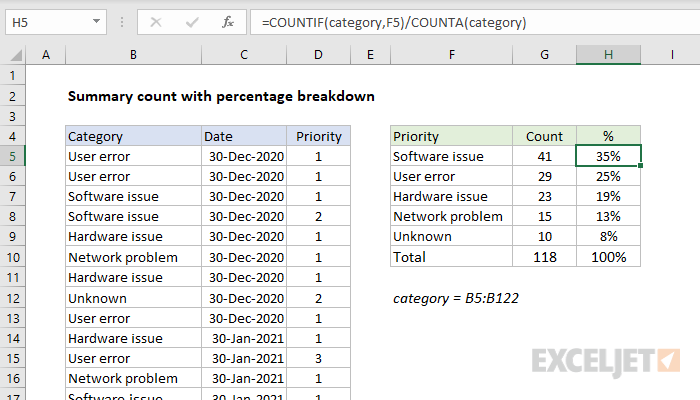
To generate a count by category with a percentage breakdown, you can use the COUNTIF function together with the COUNTA function. In the example shown, the formula in H5 is:
=COUNTIF(category,F5)/COUNTA(category)
where category is the named range B5:B122. The results in column H are decimal values with the percentage number format applied.
Generic formula
=COUNTIF(range,criteria)/COUNTA(range)
Explanation
In this example, the goal is to calculate a count and percentage for each category shown in column B. For convenience, the category values in column B are in the named range category (B5:B122). To generate the count, we use the COUNTIF function. The formula in G5, copied through the range G5:G9 is:
=COUNTIF(category,F5)
The range is the named range category (B5:B122), and the criteria as is supplied as a reference to F5, which simply picks up the text value in column F. As the formula is copied down, it returns the count of each category listed F5:F9.
To calculate the percentage shown in column H, we need to divide the count per category by the total count. The formula in H5 is:
=COUNTIF(category,F5)/COUNTA(category)
On the left, COUNTIF is configured as explained above. On the right, we use COUNTA to count total values in the named range category (B5:B122) to generate a total count. The formula is evaluated like this:
=COUNTIF(category,F5)/COUNTA(category)
=41/118
=0.3475
The results in column H are decimal values formatted with the Percentage" number format.
Note: since we already have a count per category in column G, it would be more efficient to pick that count in this formula instead of recalculating the same count again in column H. However, COUNTIFS and COUNTA are shown together here as a standalone solution.
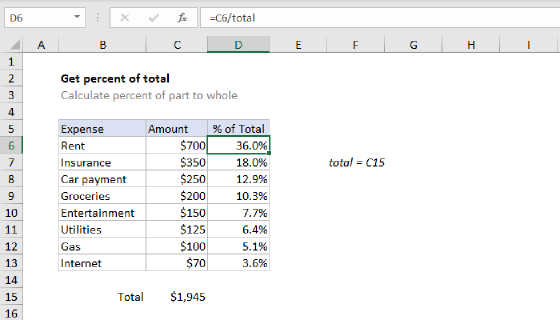
Formatting percentages in Excel
In mathematics, a percentage is a number expressed as a fraction of 100. For example, 65% is read as "Sixty-five percent" and is equivalent to 65/100 or 0.65. Accordingly, the values in column H are decimal values, with the Percentage number format applied.
Pivot table option
A pivot table would also be a good way to solve this problem.