Summary
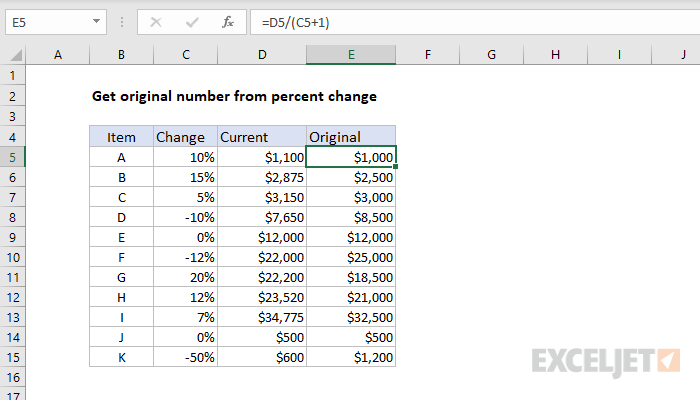
To calculate the original number based on current value and known percentage change, you can use a simple formula that divides the current value by the percent + 1. In the example shown, the formula in cell E5 is:
=D5/(C5+1)
The results in column E are decimal values with the percentage number format applied.
Generic formula
=current/(percent+1)
Explanation
In this example, the goal is to calculate the "original" value when the current value and percentage change are known. For example, if we know the current value is 1100, after an increase of 10%, we want to calculate the original value (1000) with an Excel formula. Although the language may vary, this kind of formula can be used in different ways:
- To calculate an original value based on a known percentage change.
- To calculate an original amount after a specific markup has been applied.
- To calculate a pre-tax value after a specific tax rate has already been applied.
General formula
Assuming a current value of 1100 and a after a known increase of 10%, the general formula for this calculation, where "x" is the original number, is:
x=current/(percentage+1)
x=1100/(10%+1)
x=1100/1.10
x=1000
Excel formula
Converting this to an Excel formula with cell references, the formula in E5 becomes:
=D5/(C5+1)
=1100/(0.1+1)
=1100/1.1
=1000
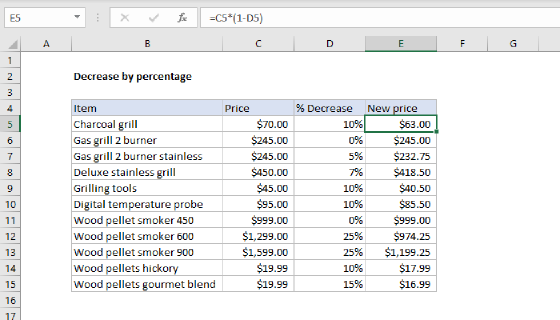
As the formula is copied down, the formula returns the original price for each item in the table, based on the percentages shown in column C and the current values in column D.
Formatting percentages in Excel
In mathematics, a percentage is a number expressed as a fraction of 100. For example, 65% is read as "Sixty-five percent" and is equivalent to 65/100 or 0.65. Accordingly, the values in column C are decimal values, with the Percentage number format applied.