=SUBTOTAL(function_num, ref1, [ref2], ...)- function_num - A number that specifies which function to use in calculating subtotals within a list. See table below for full list.
- ref1 - A named range or reference to subtotal.
- ref2 - [optional] A named range or reference to subtotal.
Using the SUBTOTAL function
The SUBTOTAL function is designed to run a given calculation on a range of cells while ignoring cells that should not be included. SUBTOTAL has three features that make it especially useful:
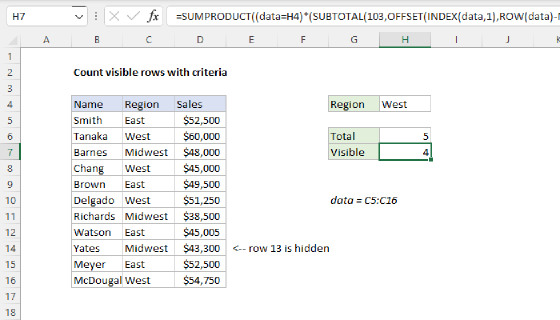
- It automatically ignores cells that have been filtered out of view.
- It automatically ignores existing subtotal formulas to avoid double counting.
- It can perform many calculations, including SUM, AVERAGE, COUNT, MAX, MIN, and others.
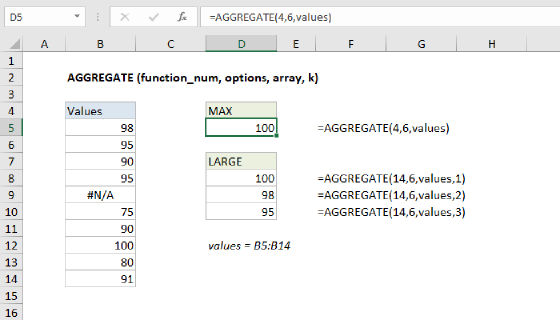
Because SUBTOTAL ignores cells that have been "filtered out", it is especially useful in Excel Tables or filtered data. In addition, SUBTOTAL can be optionally set to exclude values in rows that have been manually hidden (i.e. rows hidden with a shortcut or by Right click > Hide). Regardless of the calculation performed, SUBTOTAL returns single aggregate result from a set of data. Finally, while SUBTOTAL is good at ignoring things, it does not ignore errors. If you need capability, see the AGGREGATE function.
Note: the SUBTOTAL function automatically ignores other SUBTOTAL formulas that exist in references to prevent double-counting.
Examples
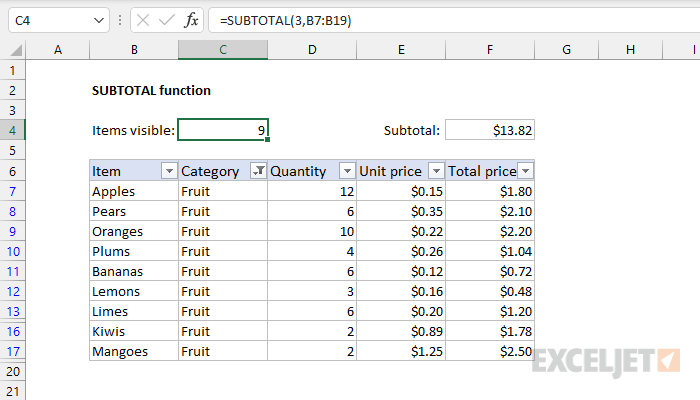
Below are examples of SUBTOTAL configured to SUM, COUNT, and AVERAGE the values in a range. Notice the only difference is the value used for the function_num argument:
=SUBTOTAL(109,range) // SUM
=SUBTOTAL(103,range) // COUNT
=SUBTOTAL(101,range) // AVERAGE
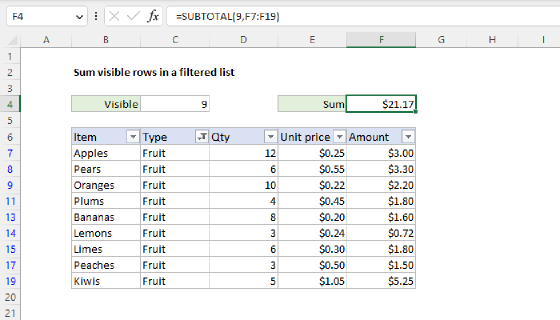
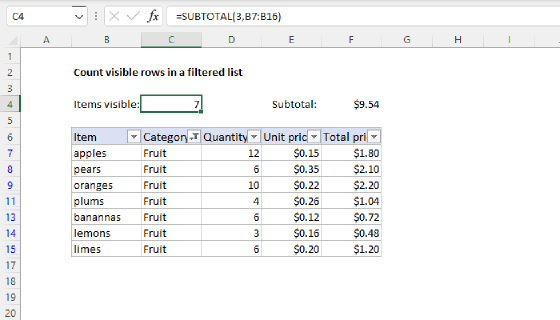
In the worksheet shown above, the formulas in C4 and F4 are:
=SUBTOTAL(3,B7:B19) // count visible
=SUBTOTAL(9,F7:F19) // sum visible
Available calculations
The calculation performed by SUBTOTAL is determined by the function_num argument, which is given as a number. There are 11 calculations total, each with two options, as seen below. Notice these values are "paired" (e.g. 1-101, 2-102, 3-103, and so on). This is related to how SUBTOTAL deals with manually hidden rows. When function_num is between 1-11, SUBTOTAL includes rows that have been manually hidden. When function_num is between 101-111, SUBTOTAL excludes rows that have been manually hidden.
| Function | Include hidden | Ignore hidden |
|---|---|---|
| AVERAGE | 1 | 101 |
| COUNT | 2 | 102 |
| COUNTA | 3 | 103 |
| MAX | 4 | 104 |
| MIN | 5 | 105 |
| PRODUCT | 6 | 106 |
| STDEV | 7 | 107 |
| STDEVP | 8 | 108 |
| SUM | 9 | 109 |
| VAR | 10 | 110 |
| VARP | 11 | 111 |
Note: SUBTOTAL always ignores values in cells that are hidden with a filter. Values in rows that have been "filtered out" are never included, regardless of function_num.
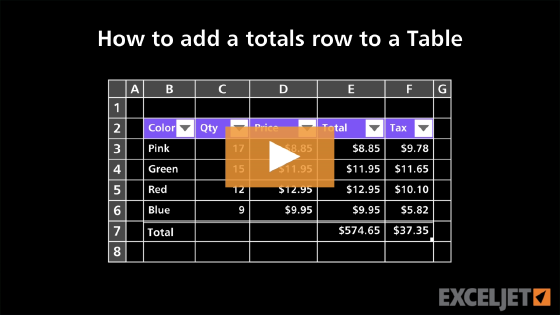
SUBTOTAL in Excel Tables
The SUBTOTAL function is used when you display a Total row in an Excel Table. Excel inserts the SUBTOTAL function automatically, and you can use a drop-down menu to switch behavior and show max, min, average, etc. Excel uses SUBTOTAL for calculations in the Total row of an Excel Table because SUBTOTAL automatically excludes rows hidden by the filter controls at the top of the table. That is, as you filter rows in a table with a Total row, calculations automatically respect the filter.
SUBTOTAL with outlines
Excel has a Subtotal feature that automatically inserts SUBTOTAL formulas in sorted data. You can find this feature at Data > Outline > Subtotal. SUBTOTAL formulas inserted this way use the standard function numbers 1-11. This allows the subtotal results to remain visible even as rows are hidden and displayed when the outline is collapsed and expanded.
Note: although the Outline feature is an "easy" way to insert subtotals in a set of data, a Pivot Table is a better and more flexible way to analyze data. In addition, a Pivot Table will separate the data from the presentation of the data, which is a best practice.
Notes
- When function_num is between 1-11, SUBTOTAL includes manually hidden rows.
- When function_num is between 101-111, SUBTOTAL excludes manually hidden rows.
- In filtered lists, SUBTOTAL always ignores values in hidden rows, regardless of function_num.
- SUBTOTAL ignores other SUBTOTAL formulas that exist in references to prevent double-counting.
- SUBTOTAL works with vertical data. In horizontal ranges, values in hidden columns are always included.