Purpose
Get the standard deviation in a sample
Return value
Estimated standard deviation
Syntax
=STDEV(number1, [number2], ...)- number1 - First number or reference in the sample.
- number2 - [optional] Second number or reference.
Using the STDEV function
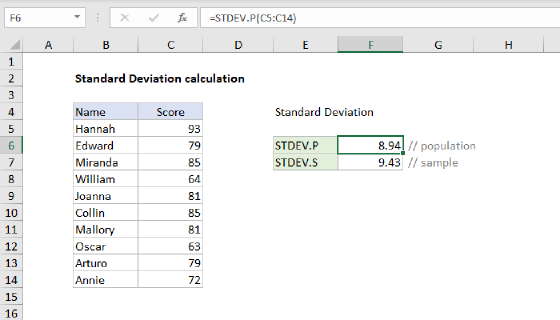
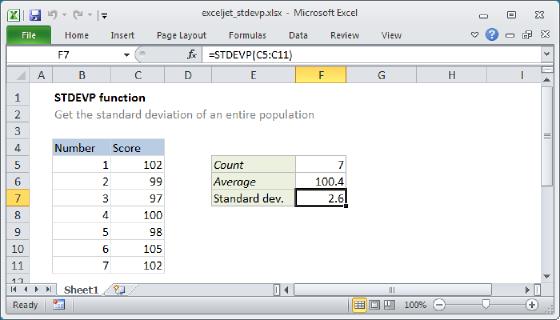
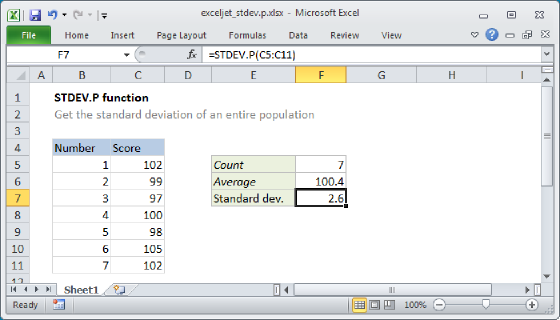
The STDEV function calculates the standard deviation for a sample set of data. Standard deviation measures how much variance there is in a set of numbers compared to the average (mean) of the numbers. The STDEV function is meant to estimate standard deviation in a sample. If data represents an entire population, use the STDEVP function.
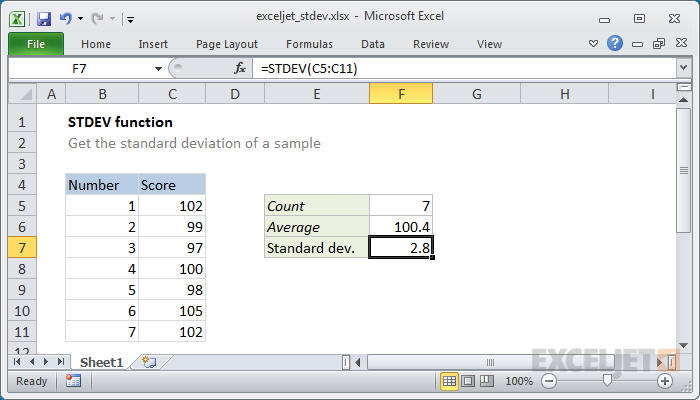
In the example shown, the formula in F7 is:
=STDEV(C5:C11)
Note: Microsoft classifies STDEV as a "compatibility function", now replaced by the STDEV.S function.
Standard Deviation functions in Excel
The table below summarizes the standard deviation functions provided by Excel.
| Name | Data set | Text and logicals |
|---|---|---|
| STDEV | Sample | Ignored |
| STDEVP | Population | Ignored |
| STDEV.S | Sample | Ignored |
| STDEV.P | Population | Ignored |
| STDEVA | Sample | Evaluated |
| STDEVPA | Population | Evaluated |
Notes:
- STDEV calculates standard deviation using the "n-1" method.
- STDEV assumes data is a sample only. When data represents an entire population, use STDEVP or STDEV.P.
- Numbers are supplied as arguments. They can be supplied as actual numbers, ranges, arrays, or references that contain numbers.
- STDEV ignores text and logical values that occur in references, but evaluates text and logicals hardcoded as function arguments.
- To evaluate logical values and/or text in the calculation, use the STDEVA function.