=STOCKHISTORY(stock, start_date, [end_date], [interval], [headers], [properties], ...)- stock - A ticker symbol in double quotes ("MSFT", "AAPL", "GOOG", etc.).
- start_date - The start date for data to be retrieved.
- end_date - [optional] The end date for data to be retrieved. Default is start_date.
- interval - [optional] Time interval. Daily = 0, weekly = 1, monthly = 2. Default is 0.
- headers - [optional] No header = 0, basic header = 1, instrument + header = 2. Default is 1.
- properties - [optional] Additional data to retrieve. Default is Date and Close. See below.
Using the STOCKHISTORY function
The STOCKHISTORY function retrieves historical stock price information based on a given symbol and date range. The main purpose of STOCKHISTORY is to get the history of a financial instrument over time. Although the name suggests that STOCKHISTORY is meant to work only with stocks, STOCKHISTORY can also work with bonds, index funds, mutual funds, and currency exchange rates. Note that STOCKHISTORY retrieves multiple results. The result is an array of values that spill onto the worksheet into multiple cells.
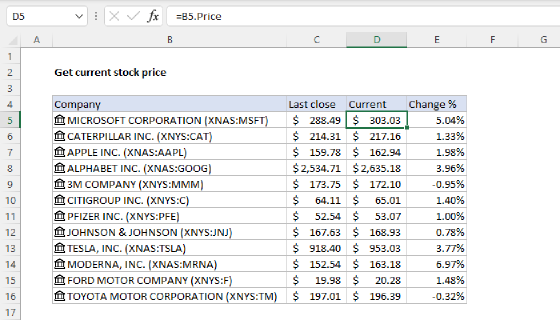
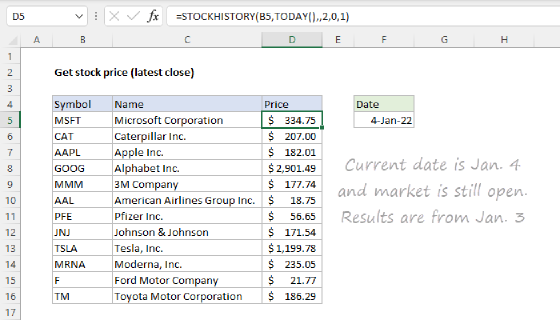
STOCKHISTORY only returns historical information recorded after market close. If you need a current stock price, use the stock datatype, as explained here: Get current stock price. The data provided by STOCKHISTORY comes from LSEG Data & Analytics (previously Refinitiv). The feed updates once per trading day, after markets close. Keep in mind that to get the latest data you may need to refresh the worksheet manually (Data › Refresh All). Microsoft cautions that all figures are provided “as‑is” and may be delayed, so use them for analysis only, not real‑time trading decisions.
Table of Contents
- Primary arguments
- Additional properties
- Specifying the exchange
- Example - Daily close prices
- Example - Monthly close prices
- Example - Make inputs variable
- Example - Specifying additional properties
- Example - A horizontal layout for multiple stocks
- Example - Last 6 months
- Example - Make exchange variable
- Example - Retrieve currency exchange rates
Primary arguments
The STOCKHISTORY function accepts five primary arguments, and six additional property arguments to retrieve additional information. Stock and start_date are the only required arguments. Each argument is described in detail below. Additional properties are described in the table here.
- Stock - the ticker symbol used to retrieve historical prices. Stock should be supplied as a text value in double quotes ("") when hardcoded, for example, "MSFT", "GOOG", "AAPL", "TSLA", etc. Results are retrieved from the default exchange for the instrument.
- Start_date - The date at which to start retrieving data. Note that start_date is not necessarily the first date that will appear in the results. If the interval is set to daily (0), the first date in the results will be the first date that the exchange is open and data is available. If the interval is set to weekly (1) or monthly (2), the first date will be set to the first date in the period, i.e., the first day of the week or the first day of the month.
- End_date - The date at which to stop retrieving data. Like start_date, the actual last date in results may be different from the end_date provided. If the interval is set to daily (0), the last date in the results will be the last date in the date range that data is available. If the interval is set to weekly (1) or monthly (2), the last date will be the last date in the period, i.e., the last day of the week or the last day of the month. End_date is optional and will default to start_date if not supplied.
- Interval - the time period between data points. The available options are Daily (0), Weekly (1), and Monthly (2). Interval is optional and will default to Daily (0) if not provided.
- Headers - the headers argument controls header information that will appear at the top of the data retrieved. The available options are No header (0), Basic header (1), and header with instrument information (2). Headers is optional and will default to basic header (1) when not provided.
- Properties - six arguments for additional information that can be retrieved. See the table below for details.
Note: The safest way to provide the start_date and end_date is as a reference to a cell that contains a valid date or with the DATE function because dates as text values can sometimes be misinterpreted.
Additional Properties
The table below shows the additional information the STOCKHISTORY function can retrieve, which are described as properties. Properties are specified with the numeric code seen in the "Code" column.
| Code | Value | Description |
|---|---|---|
| 0 | Date | The first trading day in the period |
| 1 | Close | Closing price on the last trading day in the period |
| 2 | Open | The opening price on the last trading day in the period |
| 3 | High | The highest price in the period |
| 4 | Low | The lowest price in the period |
| 5 | Volume | Volume traded during the period |
The order in which you request properties is the order in which they will appear. See: STOCKHISTORY properties example.
Note that by default, STOCKHISTORY will return the Date and Close properties, so there is no need to ask for Date and Close if these are the only properties you need. However, if you request any properties, you will override this default behavior and will need to specify all the properties you want.
Specifying the exchange
When requesting the price for a stock symbol, results are retrieved from the default exchange for the instrument. To request information from a specific exchange, prefix the symbol with a 4-character ISO market identifier code (MIC), followed by a colon. For example, to refer to Microsoft Corporation on the Nasdaq Stock Market, use "XNAS:MSFT". To refer to Microsoft Corporation on Austria's Wiener Boerse exchange, use "XWBO:MSFT". The table below lists the 4-character code for a few common exchanges.
| Exchange Name | Code | Country |
|---|---|---|
| New York Stock Exchange | XNYS | United States |
| Nasdaq Stock Market | XNAS | United States |
| London Stock Exchange | XLON | United Kingdom |
You can find a full list of supported exchange codes here.
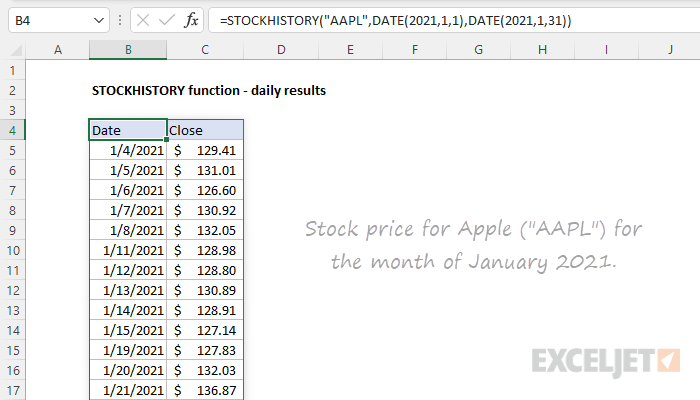
Example - Get daily close prices for a stock
To retrieve the daily close price for Apple ("AAPL") for the month of January 2021, the formula in cell B4 is:
=STOCKHISTORY("AAPL",DATE(2021,1,1),DATE(2021,1,31))
Interval is not provided and defaults to Daily (0). Headers is not provided and defaults to Date and Close. With this configuration, the STOCKHISTORY function returns 19 results. Note that weekends are excluded and the first date retrieved is January 4 since the exchange was closed January 1-3. Also note the DATE function is used to supply the start and end dates.
For a more detailed explanation, see this example.
Example - Monthly close prices
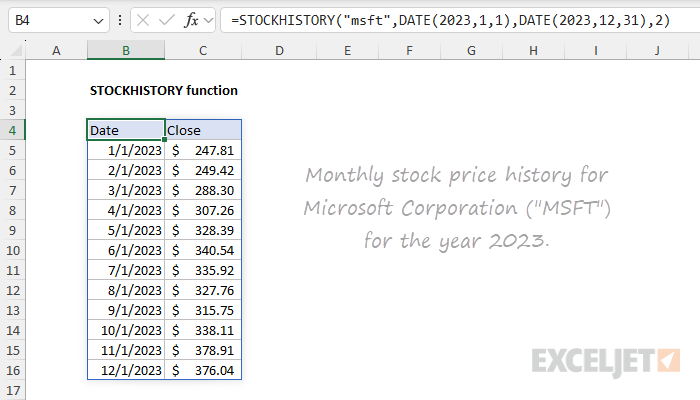
The STOCKHISTORY function can retrieve daily (0), weekly (1), and monthly (2) price data by setting a value for the interval argument. For example, to get monthly close prices for Apple, Inc. ("AAPL") for all of 2023, set the interval to 2. In the workbook below, the formula in cell B4 is:
=STOCKHISTORY("AAPL",DATE(2023,1,1),DATE(2023,12,31),2)
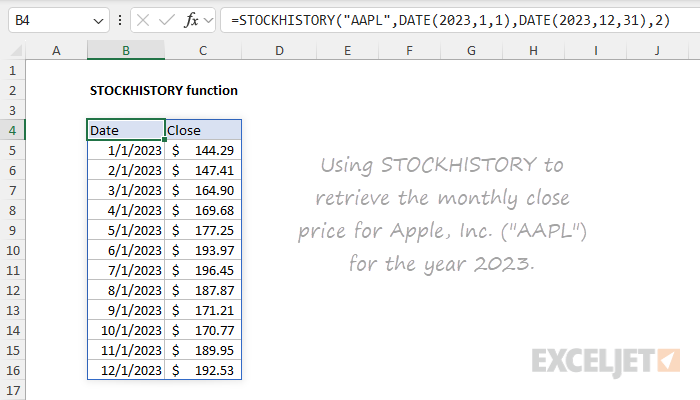
Note that the interval argument is now provided as 2 in order to retrieve monthly results.
Note: When the interval is provided as 2, STOCKHISTORY will return the last closing price in a given month, regardless of the date. In other words, the result for the first of the month will be the same as the last day of the month.
Example - Make inputs variable
In the example below, the inputs for stock, start_date, and end_date are made variable by exposing them on the worksheet in cells F6, F7, and F8. The formula in cell B4 is:
=STOCKHISTORY(F6,F7,F8,2)
Note that the fourth argument, interval, is set to 2, which outputs monthly results.
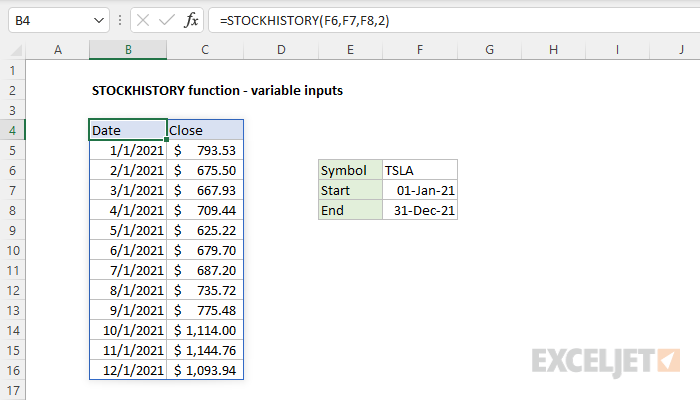
The result is the close price for Tesla ("TSLA") for the 12 months in 2021. If the values in F6:F8 are changed, the results from STOCKHISTORY will automatically update.
Example - Additional properties
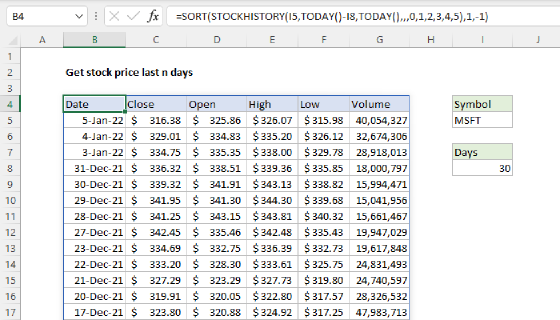
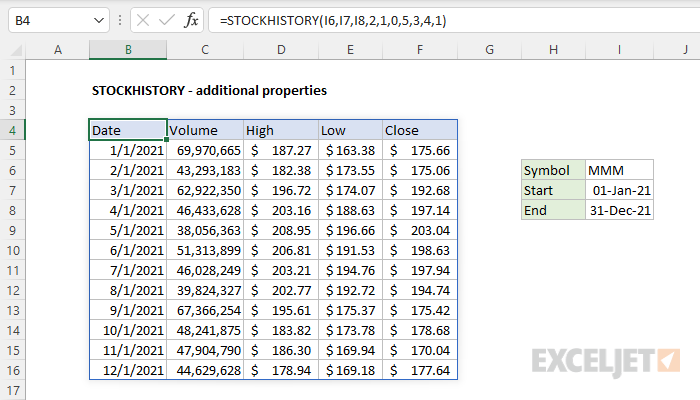
The properties returned by STOCKHISTORY can be controlled by customizing and/or reordering numbers starting with the sixth argument (property1). In the example shown below, the formula in cell B4 is:
=STOCKHISTORY(I6,I7,I8,2,1,0,5,3,4,1)
The result is monthly stock price information for The 3M Company ("MMM") for the year 2021. The properties requested include Date (0), Volume (5), High (3), Low (4), and Close (1). Notice these are the last 5 arguments in the function.
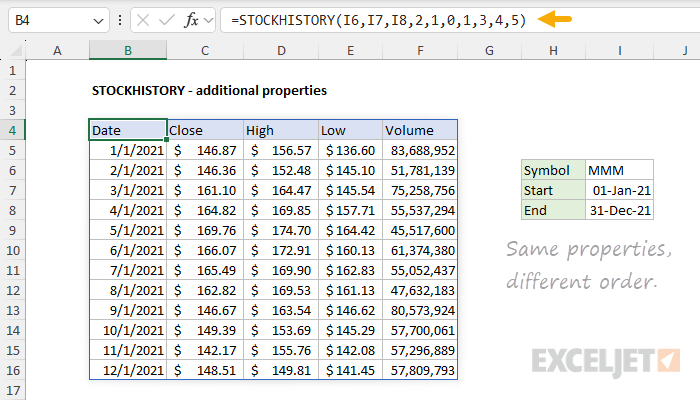
Note that the reason STOCKHISTORY uses numeric codes for properties is so they can be easily reordered. In the worksheet below, we are returning the same five properties in a new order: Date, Close, High, Low, and Volume. The formula in cell B4 is now:
=STOCKHISTORY(I6,I7,I8,2,1,0,1,3,4,5)
For a full list of properties with codes and descriptions, see the Properties section.
Example - A horizontal layout for multiple stocks
By default, STOCKHISTORY returns information in a vertical layout. To display results in a horizontal layout, you can use the TRANSPOSE function. In the example shown below, the formula in C5, copied down, is:
=TRANSPOSE(STOCKHISTORY(B5,DATE(2024,1,1),DATE(2024,6,1),2,0,1))
The result is the trailing monthly close price for each symbol for the first 6 months of 2024:
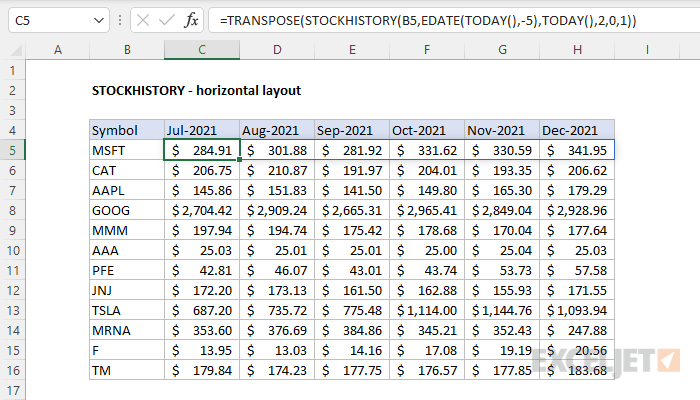
TRANSPOSE takes what would normally be a vertical layout and converts it to a horizontal layout.
Example - last 6 months
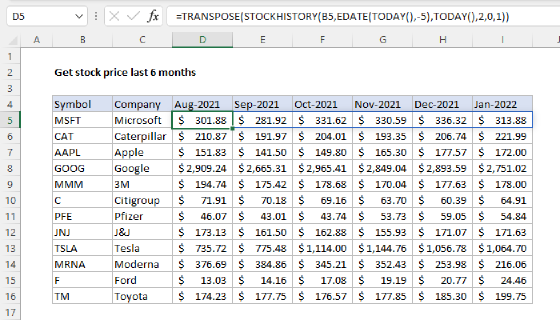
To get the monthly close price for a list of stocks for the last 6 complete months, you can use a formula based on the TODAY function. You can see the result in the workbook below, where the formula in C5 is:
=TRANSPOSE(STOCKHISTORY(B5,EOMONTH(TODAY(),-7)+1,EOMONTH(TODAY(),-1)+1,2,0,1))
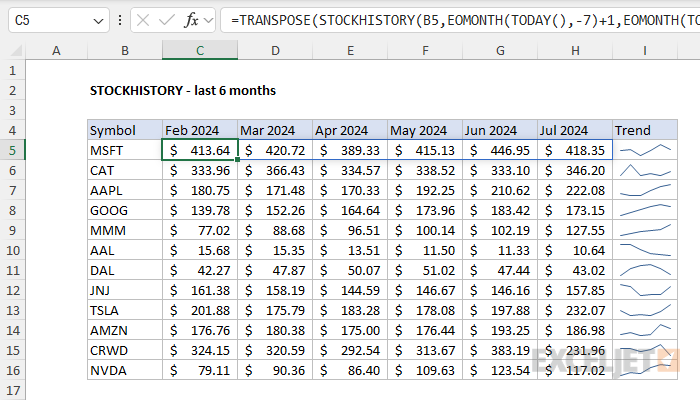
This formula is dynamic and will continue to return data for the last 6 months over time. The EOMONTH function and the TODAY function are used to create a start date on the first day of the month, 6 months before the current month. The end date is created in the same way and is the first day of the previous month. The formula here is a variation of an example explained in greater detail here.
Notes: (1) Because the TODAY function will recalculate each time a worksheet is opened, the STOCKHISTORY function also recalculates when the worksheet is opened. (2) The trend line is created by selecting a range like C5:H5 and inserting a sparkling at Insert > Sparklines > Line.
Example - Make exchange variable
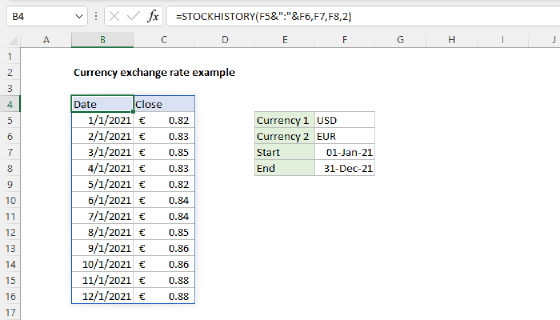
To request information from a specific exchange, prefix the symbol with a 4-character code, followed by a colon (:). In the worksheet below, the exchange is variable and entered in cell F5. The formula in cell B4 is:
=STOCKHISTORY(F5&":"&F6,F7,F8,2)
The result is the monthly close price for Caterpillar, Inc. on the Wiener-Borse exchange:
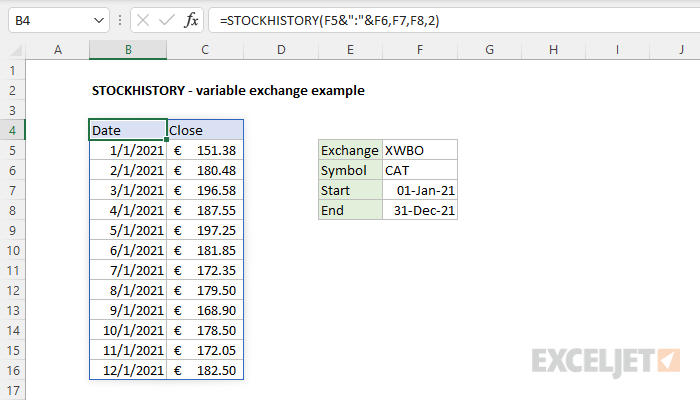
If the value in F5 is changed to "XNYS," STOCKHISTORY will return Caterpillar's monthly close price on the New York Stock Exchange.
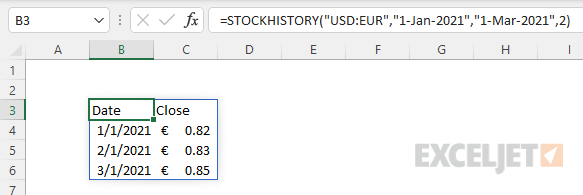
Example - Retrieve currency exchange rates
To get the currency exchange rate for a given currency pair with STOCKHISTORY, enter the two 3-letter codes separated by a colon (:) as the stock argument. For example, to get the monthly currency exchange rate between the US Dollar ("USD") and the Euro ("EUR") for the months of January 2021 through March 2021, you can use STOCKHISTORY like this:
=STOCKHISTORY("USD:EUR","1-Jan-2021","1-Mar-2021",2)
The result is an array with three months of rates:
To reverse the direction of the exchange, just swap the order of the currency pairs:
=STOCKHISTORY("EUR:USD","1-Jan-2021","1-Mar-2021",2)
For a more detailed explanation, see this example.
Notes
- If data is not available for the period requested, STOCKHISTORY returns a #VALUE! error.
- When interval is monthly (2), STOCKHISTORY returns the latest data in a given month. In other words, you will get the latest closing price when a month is not yet complete.
- By default, STOCKHISTORY will return the date and closing price, but this behavior can be adjusted by specifying custom properties.
- STOCKHISTORY only returns historical information recorded after market close. If you need a current stock price, use the stock datatype, as explained here: Get current stock price.