Explanation
In this example, the goal is to retrieve the close price on July 1, 2021 for each symbol shown in column B. This can be done with the STOCKHISTORY function, whose main purpose is to retrieve historical information for a financial instrument over time. In many configurations, STOCKHISTORY returns an array of values that spill onto the worksheet into multiple cells. However, in this case, we want only a single result for each symbol. The formula is tied to the date entered in cell F5, which can be changed at any time.
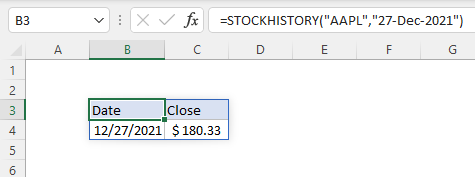
STOCKHISTORY retrieves historical stock price information based on a given symbol and date range. For example, to return the closing price for Apple, Inc. on December 27, 2021, you can use STOCKHISTORY like this:
=STOCKHISTORY("AAPL","27-Dec-2021") // close price on Dec 27
The result is an array that includes headers, date, and close price:

We only need to provide start_date because the end_date will automatically default to the start_date if not provided. This gives us the basic information we want, but we need to remove the date and the header, since we only want the close price. We start by providing a reference to the symbol in B5 and the date in cell F5:
=STOCKHISTORY(B5,$F$5
Notice $F$5 is entered as an absolute reference to prevent this reference from changing as the formula is copied down the table. The final formula looks like this:
=STOCKHISTORY(B5,$F$5,,0,0,1)
In this version, end_date is left blank, interval is set to 0 for daily, headers is set to 0 (no headers), and the final argument is property1, which is given as 1 to retrieve the price. More on STOCKHISTORY properties here.
As the formula is copied down, STOCKHISTORY retrieves the close price for each symbol in column B on July 1, 2021. If the date in cell F5 is changed, STOCKHISTORY retrieves a new set of close prices.


