=PROB(x_range, prob_range, lower_limit, [upper_limit])- x_range - A range of numeric values representing the possible outcomes.
- prob_range - A range of probabilities corresponding to the values in x_range (must sum to 1).
- lower_limit - The lower bound for the probability calculation.
- upper_limit - [optional] The upper bound for the probability calculation. If omitted, PROB returns the probability that x equals lower_limit.
Using the PROB function
The PROB function calculates probabilities for discrete probability distributions by summing the probabilities of all values in the x_range that fall within the specified limits. When upper_limit is omitted, PROB returns probability of the lower_limit value. This function is useful for analyzing discrete data where you have known outcomes and their associated probabilities.
Key features
- Works with discrete probability distributions
- Requires probabilities in prob_range to sum to 1
- Can calculate probability for a single value or a range of values
- When upper_limit is omitted, returns probability of the lower_limit value
- Returns #NUM! error if probabilities don't sum to 1
Table of contents
- Key features
- Example #1 - Single value probability
- Example #2 - Range probability
- Example #3 - Error conditions
- When to use PROB
Example #1 - Single value probability
In this example, we have a dataset showing quiz scores and their corresponding probabilities. To find the probability of getting exactly a score of 7, we pass in 7 for the value of lower_limit.
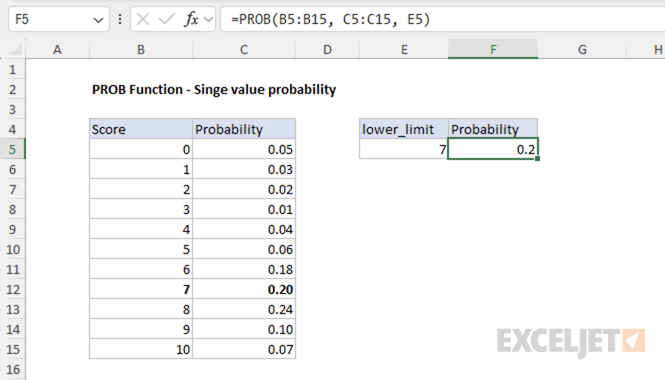
=PROB(B5:B15, C5:C15, E5)
This formula returns 0.20, meaning there is a 20% chance of getting exactly a score of 7.
The function works by:
- Finding the value 7 in the x_range (B5:B15)
- Returning the corresponding probability from prob_range (C5:C15)
- Since 7 appears in the table, it returns the probability of 0.20
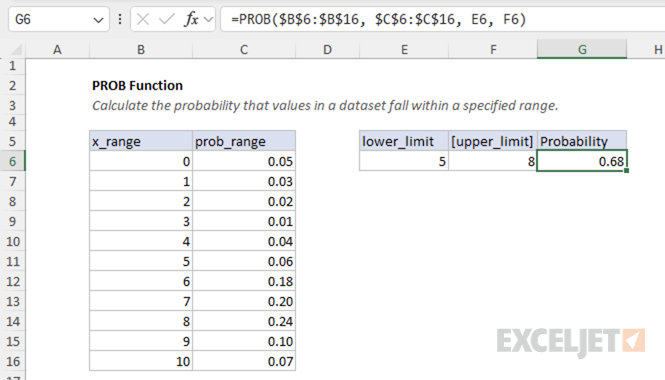
Example #2 - Range probability
To find the probability of getting a score between 5 and 8 (inclusive), we use both the lower_limit and upper_limit arguments:
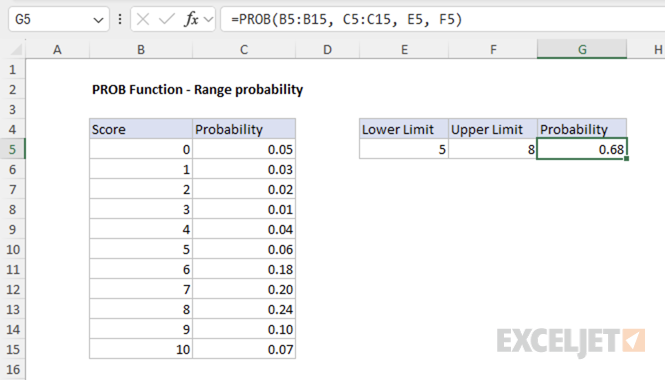
=PROB(B5:B15, C5:C15, E5, F5)
This formula returns 0.68, meaning there is a 68% chance of getting a score between 5 and 8 inclusive.
The function works by:
- Finding all values in x_range that are >= 5 and <= 8
- Summing the corresponding probabilities from prob_range
- For scores 5, 6, 7, and 8: the probabilities sum to 0.68
Example #3 - Error conditions
The PROB function returns the following errors:
If the probabilities in prob_range don't sum to 1, the function returns #NUM! error
=PROB({1,2,3},{0.2,0.3,0.4},2) // returns #NUM!
If x_range and prob_range have different numbers of values, the function returns #N/A error
=PROB({1,2,3},{0.2,0.3},2) // returns #N/A
If any argument is non-numeric or contains non-numeric values (e.g., text), the function returns #NUM! error
=PROB({"1",2,3},{0.2,0.3,0.5},2) // returns #NUM!
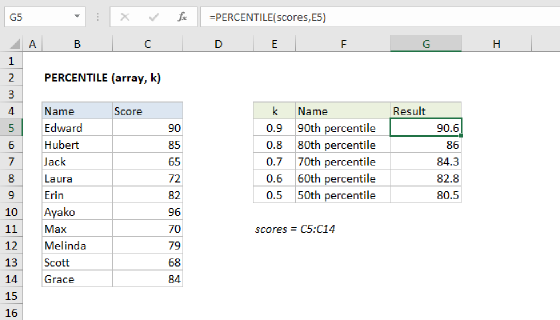
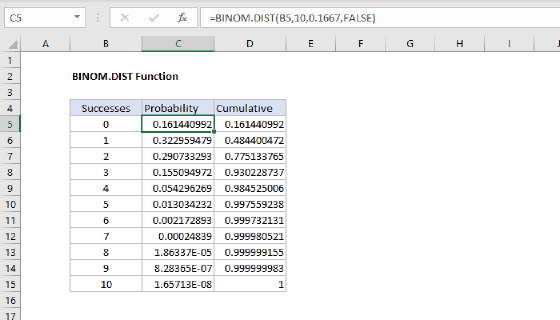
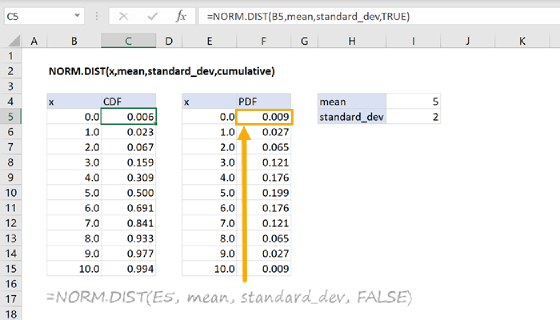
When to use PROB
The PROB function is ideal for analyzing discrete probability distributions like calculating probabilities for survey results. These are scenarios where you have a complete set of possible outcomes and their associated probabilities. For continuous probability distributions, Excel provides distribution functions like NORM.DIST, EXPON.DIST, or WEIBULL.DIST.