=PHI(x)- x - The value (z-score) for which you want the density of the standard normal distribution.
Using the PHI function
The PHI function calculates the value of the probability density function for a standard normal distribution at a given point. The standard normal distribution is a normal distribution with a mean of 0 and a standard deviation of 1. The PHI function is often used in statistical analysis, data science, and financial modeling to understand how likely a value is within a standard normal distribution.
For example, the following formula returns the value of the standard normal density function at 1:
=PHI(1) // returns 0.241970725
Key features
- Returns the relative likelihood of a value in the standard normal distribution
- Useful for statistical analysis, anomaly detection, and model building
- Works only with standard normal distributions (mean = 0, standard deviation = 1)
Note: PHI returns the value of the density function, not the cumulative probability. PHI is equivalent to NORM.S.DIST with the cumulative flag set to FALSE. To get the cumulative probability, use NORM.S.DIST with the cumulative flag set to TRUE.
Table of contents
- Key features
- Example #1 - Basic usage
- Example #2 - Using z-scores
- Example #3 - Error handling
- When to use
- Related functions
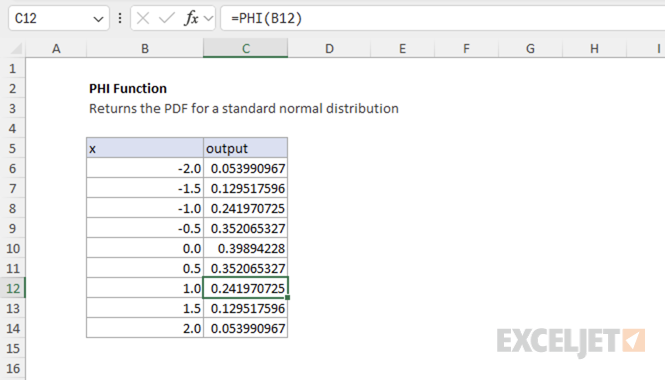
Example #1 - Basic usage
The PHI function takes a single argument, x, and returns the value of the standard normal density function at that point:
=PHI(-2) // returns 0.053990967
=PHI(-1) // returns 0.241970725
=PHI(0)  // returns 0.398942280
=PHI(1)  // returns 0.241970725
=PHI(2)  // returns 0.053990967
Example #2 - Using z-scores
The PHI function can be used to calculate PDF values for normal distributions with different means and standard deviations. For example, suppose you have a list of values from a normal distribution with a mean of 83 and a standard deviation of 5. To find the probability density for each value, you first calculate the z-score, then use the PHI function.
=PHI(STANDARDIZE(93,83,5)) // returns 0.0539909665
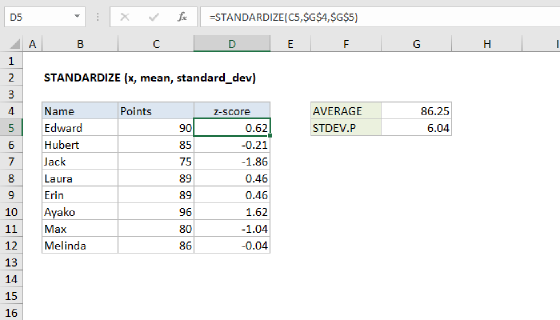
The z-score of a value, which measures how many standard deviations a value is from the mean, can be calculated using the STANDARDIZE function:
=STANDARDIZE(93,83,5) // returns 2
or manually like this:
z = (value - mean) / stdev
The following table shows the density for each value in the normal distribution with a mean of 83 and a standard deviation of 5:
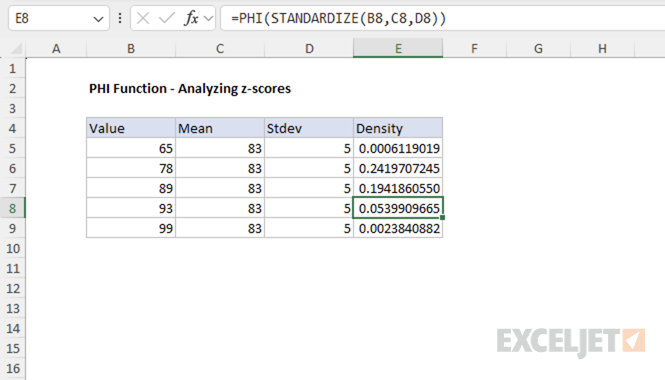
This approach allows you to use PHI to calculate the PDF for any normal distribution, not just the standard normal.
Example #3 - Error handling
The PHI function returns the #VALUE! error if x is not numeric.
=PHI("apple") // returns #VALUE!
When to use
Use the PHI function when you need the value of the standard normal density function (mean = 0, standard deviation = 1) at a specific point. PHI is equivalent to NORM.S.DIST(x, FALSE). For cumulative probability, use NORM.S.DIST(x, TRUE).
If you need the density for a normal distribution with a different mean or standard deviation, first convert your value to a z-score (see Example #2), or use the NORM.DIST function.
Related functions
Excel provides several related functions for working with normal distributions:
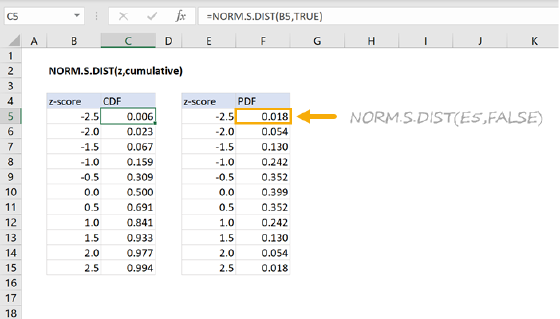
- NORM.S.DIST - Returns the cumulative distribution or density for the standard normal distribution.
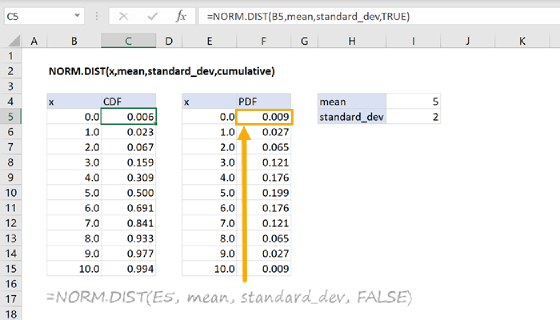
- NORM.DIST - Returns the cumulative distribution or density for a normal distribution with specified mean and standard deviation.
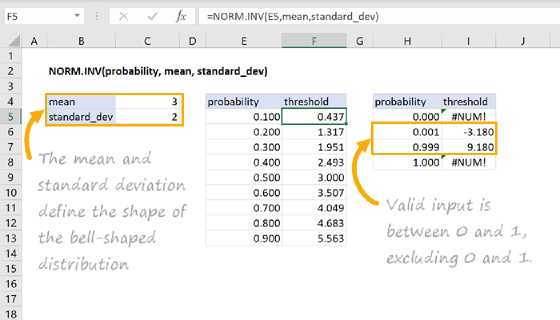
- NORM.INV - Returns the inverse of the normal cumulative distribution.
- STANDARDIZE - Converts a value to a z-score.