=EXPON.DIST(x, lambda, cumulative)- x - The value at which to evaluate the distribution (must be ≥ 0).
- lambda - The rate parameter of the distribution (must be > 0).
- cumulative - A logical value that determines the form of the function. If TRUE, returns the cumulative distribution function; if FALSE, returns the probability density function.
Using the EXPON.DIST function
The EXPON.DIST function calculates values for the exponential distribution, which is a continuous probability distribution used to model the time between events in a Poisson process. The exponential distribution is characterized by its "memoryless" property, meaning the probability of an event occurring in the next time interval is independent of how much time has already elapsed. This makes it ideal for modeling systems with constant event rates, such as radioactive decay, customer arrivals, and equipment failures with no aging effects.
Key features
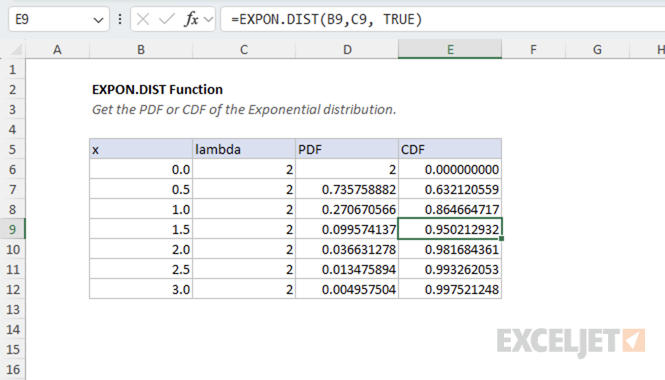
- Returns either the probability density function (PDF) or the cumulative distribution function (CDF)
- Rate parameter (lambda) controls the average time between events
- Constant failure rate over time
EXPON.DIST replaces the older EXPONDIST function, which is still available for backward compatibility. Microsoft recommends using EXPON.DIST for new work.
Table of contents
- Key features
- Example #1 - Customer arrival analysis
- Example #2 - Effect of rate parameter (lambda)
- Example #3 - Cumulative vs. probability density
- Example #4 - Error Conditions
- When to use the exponential distribution
- Related functions
- Formula definition
Example #1 - Customer arrival analysis
Suppose we are analyzing customer arrivals at a coffee shop. Historical data suggests that customers arrive following a Poisson process with an average rate of 12 customers per hour.
This scenario is a good example of the exponential distribution because it models systems with constant arrival rates. Customers arrive independently at a constant average rate, and the probability of the next arrival doesn't depend on how long it's been since the last customer arrived.
To calculate the probability that the next customer will arrive within 10 minutes, we can use the cumulative distribution function (CDF):
=EXPON.DIST(10/60, 12, TRUE) // returns 0.865
This formula returns the probability that the next customer arrives within 10 minutes (10/60 = 0.167 hours). For example, the result 0.865 means there is an 86.5% chance the next customer will arrive within 10 minutes.
To find the probability that the next customer arrives after 10 minutes, subtract the CDF from 1:
=1-EXPON.DIST(10/60, 12, TRUE) // returns 0.135
This gives the probability that the next customer arrives after 10 minutes.
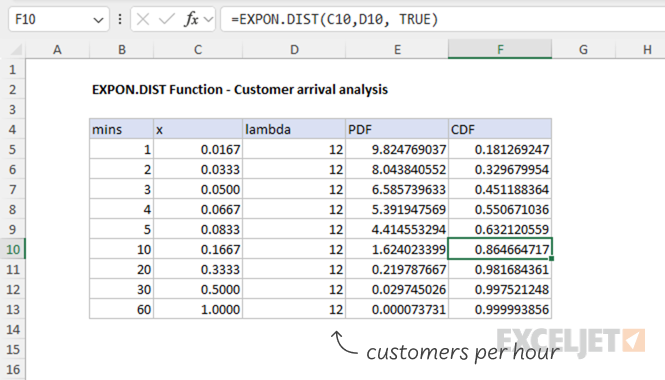
The table above shows customer arrival probabilities for different time intervals. It calculates both the probability density function (PDF) and cumulative distribution function (CDF) for arrival times ranging from 1 minute to 1 hour, using a rate of 12 customers per hour (λ = 12).
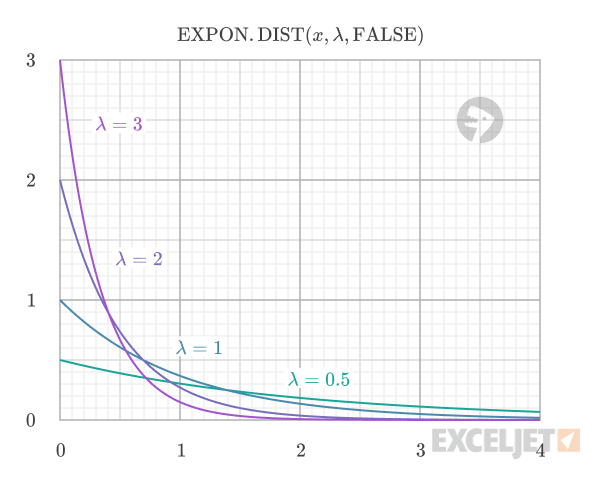
Example #2 - Effect of rate parameter (lambda)
The rate parameter (lambda) determines the average time between events. The mean time between events is equal to 1/lambda.
- Higher lambda values mean events occur more frequently (shorter average time between events)
- Lower lambda values mean events occur less frequently (longer average time between events)
For example, consider different coffee shops with varying customer traffic levels. All follow an exponential distribution, but they have different rate parameters representing their customer arrival frequencies. Compare the probability of the next customer arriving within 5 minutes for different arrival rates:
=EXPON.DIST(5/60,  6, TRUE)  // returns 0.393
=EXPON.DIST(5/60, 12, TRUE)  // returns 0.632
=EXPON.DIST(5/60, 24, TRUE)  // returns 0.865
As lambda increases, the probability of the next customer arriving within 5 minutes increases, indicating more frequent arrivals at busier locations.
Example #3 - Cumulative vs. probability density
The cumulative argument determines whether EXPON.DIST returns the cumulative distribution function (CDF) or the probability density function (PDF).
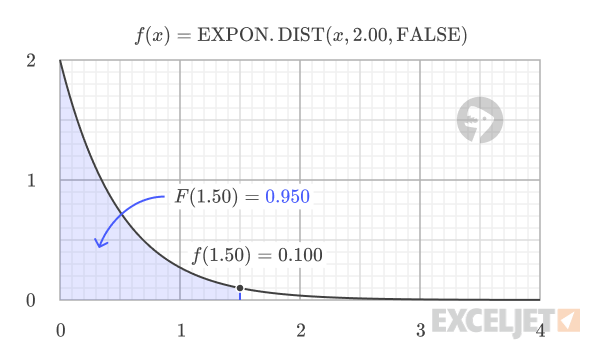
When cumulative is FALSE, the function returns the probability density function (PDF), which indicates the relative likelihood of a random variable taking on a value near a specific point. The PDF value is not a probability itself, but a measure of probability density.
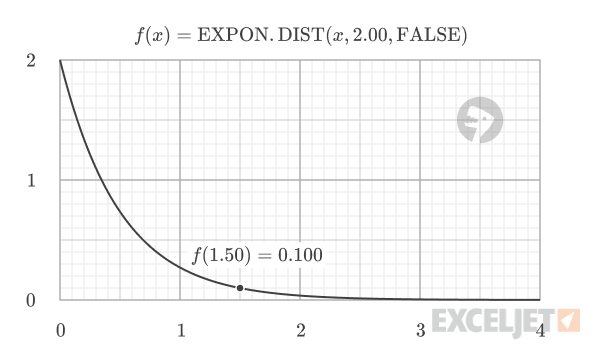
=EXPON.DIST(1.5, 2.0, FALSE) // returns 0.100 (PDF)
When cumulative is TRUE, the function returns the cumulative distribution function (CDF), which gives the probability of a random variable being less than or equal to a certain value.
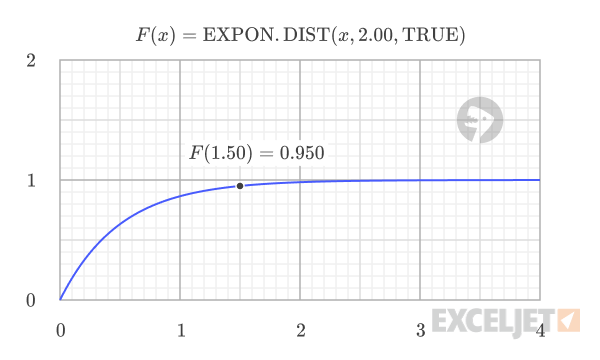
=EXPON.DIST(1.5, 2.0, TRUE) // returns 0.950 (CDF)
The CDF has a characteristic S-shape, starting at 0 and smoothly increasing toward 1 as x grows larger. The CDF value at any point equals the area under the PDF curve to the left of that point.
Using the CDF, you can easily calculate probabilities for different scenarios. To calculate the probability of an event occurring below a threshold:
=EXPON.DIST(threshold, lambda, TRUE)
To calculate the probability of an event occurring above a threshold:
=1 - EXPON.DIST(threshold, lambda, TRUE)
To calculate the probability of an event occurring between two thresholds:
=EXPON.DIST(upper, lambda, TRUE) - EXPON.DIST(lower, lambda, TRUE)
Example #4 - Error Conditions
The EXPON.DIST function returns the following errors:
- If x < 0, the function returns #NUM! error
- If lambda ≤ 0, the function returns #NUM! error
- If any argument is non-numeric, the function returns #VALUE! error
When to use the exponential distribution
The exponential distribution is ideal for modeling time-between-events data where the events occur independently at a constant average rate. Its key characteristics make it suitable for:
- Poisson processes - Modeling the time between events in a Poisson process
- Radioactive decay - Modeling the time until radioactive particles decay
- Queuing theory - Modeling inter-arrival times in service systems (banks, restaurants, call centers)
- Reliability analysis - Modeling time-to-failure for equipment with constant failure rates
The exponential distribution is a special case of the Weibull distribution when the shape parameter (alpha) equals 1, representing constant failure rates. It's also a special case of the gamma distribution when the shape parameter (alpha) equals 1.
For reliability analysis and failure modeling, the exponential distribution assumes no aging or wear-out effects. If your system shows increasing or decreasing failure rates over time, consider using the Weibull distribution instead. For modeling the time until multiple events occur, use the gamma distribution.
Related functions
Excel provides several related functions for probability distributions:
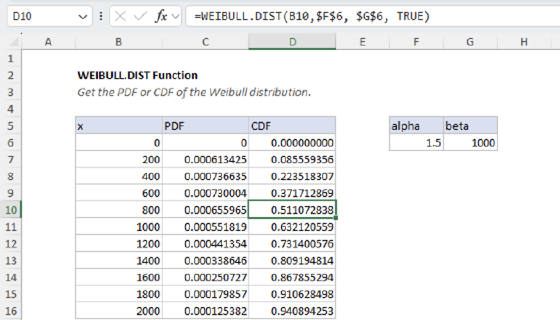
- WEIBULL.DIST - Weibull distribution (more general form, includes exponential as special case)
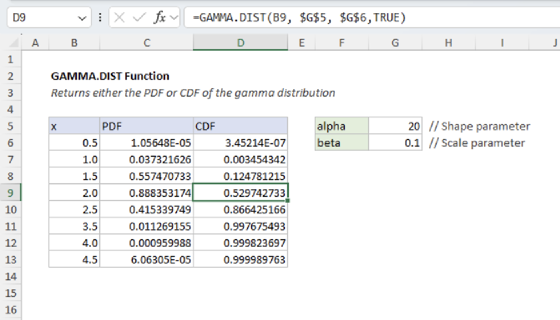
- GAMMA.DIST - Gamma distribution (sum of exponential random variables)
- POISSON.DIST - Poisson distribution (number of events in time period)
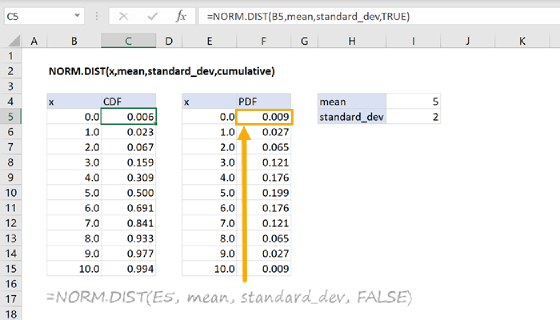
- NORM.DIST - Normal distribution
Formula definition
The formulas for the PDF and CDF of the exponential distribution are:
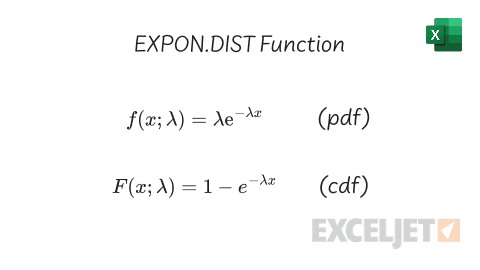
Where:
- f - probability density function
- F - cumulative distribution function
- x - the value at which to evaluate the distribution (must be ≥ 0)
- lambda - the rate parameter of the distribution (must be > 0)
- e - the exponential function (EXP function)