Summary
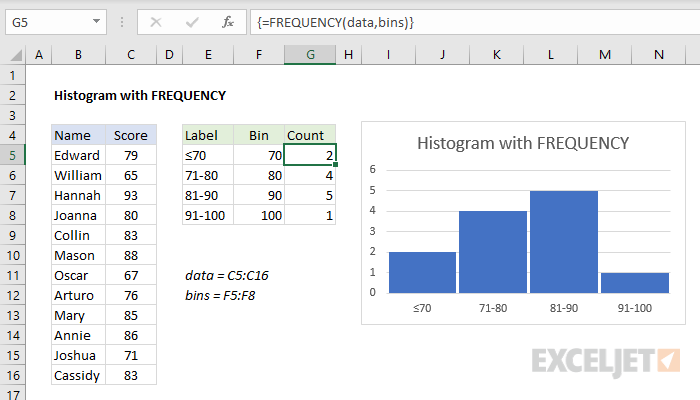
One way to create a histogram is with the FREQUENCY function. In the example shown, the formula in cells G5:G8 is:
{=FREQUENCY(data,bins)}
where data (C5:C16) and bins (F5:F8) are named ranges.
This formula is entered as a multi-cell array formula in the range G5:G8.
Explanation
Note: later versions of Excel include a native histogram chart, which is easy to create, but not as flexible to format. The example on this page shows one way to create your own histogram data with the FREQUENCY function and use a regular column chart to plot the results. Because FREQUENCY is a formula, the results and chart will dynamically update if data changes.
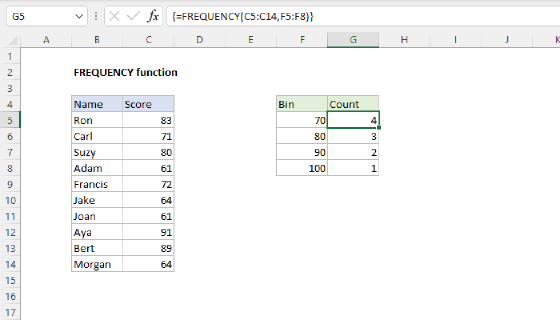
The FREQUENCY function returns a frequency distribution, which is a summary table that shows the count of each value in a range by "bin". FREQUENCY is a bit tricky to use, because must be entered as an array formula. On the other hand, once you set up your bins correctly, FREQUENCY will give you all counts at once!
Setup and formula
In the example shown, we have a list of 12 scores in the named range "data" (C5:C16). The range F5:F8 is the named range "bins". FREQUENCY will treat each bin value as the upper limit for that bin. In other words, each bin will include a count of scores up to and including the bin value. FREQUENCY will also return an "overflow count" – the count of values greater than the last bin.
To enter the FREQUENCY formula, follow these steps in the attached workbook.
-
Delete existing formulas if needed (see note below).
-
Select the range G5:G8 (all four cells).
-
Paste or type this formula in the formula bar:
=FREQUENCY(data,bins)
- Enter the formula as an array formula with control + shift + enter. Excel will automatically add curly braces {}.
Note: To edit existing formulas, you'll need to select all four cells first, then click Delete. You can select all cells at once with the shortcut control + /.
FREQUENCY will generate a count for each bin and return an array of results like this:
{2;4;5;1;0} // array returned by FREQUENCY
Excel will place the first 4 values in the range G5:G8. Notice the overflow count, zero, is also returned as the fifth element in the array, since there are no values greater than 100. This value is not shown in the worksheet, because we only entered the formula in four cells.
Excel 365
In Excel 365, you can simply enter one formula in cell G5, and results will automatically spill onto the worksheet. There is no need to use control + shift + enter. However, if you use this approach, you will see the count for the overflow bin output as well. Entering the formula in 4 cells only (as above) suppresses this last value. If you don't mind the extra value, the single formula option is easier, and you can choose not to plot the value in a chart.
Labels
The labels in E5:E8 are for readability and presentation only. These can be customized as you like. In the example shown, the formula in cell E5, copied down, is:
=IF(F5=MIN(bins),"≤"&F5,F4+1&"-"&F5)
This formula simply builds a label for each bin using the bin values in column F.
Histogram chart
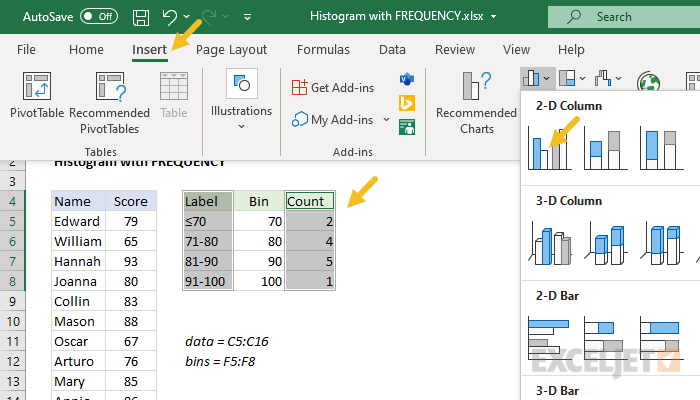
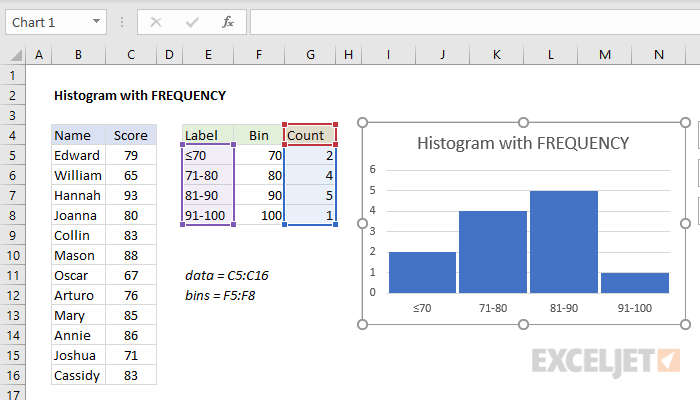
To chart the output from FREQUENCY, follow these steps. First, hold down the control key and select two ranges: E4:E8, and G4:G8. Then insert a column chart (Insert > Charts > Clustered column):
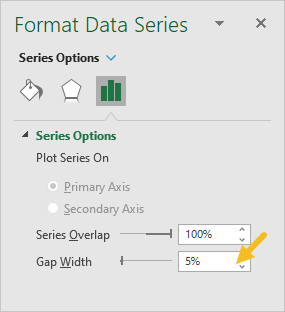
Next, right-click a bar, and format the data series to reduce the gap width to 5% (or as desired):
Change the chart title as you like. In the example shown, we pick up the value in cell B2:
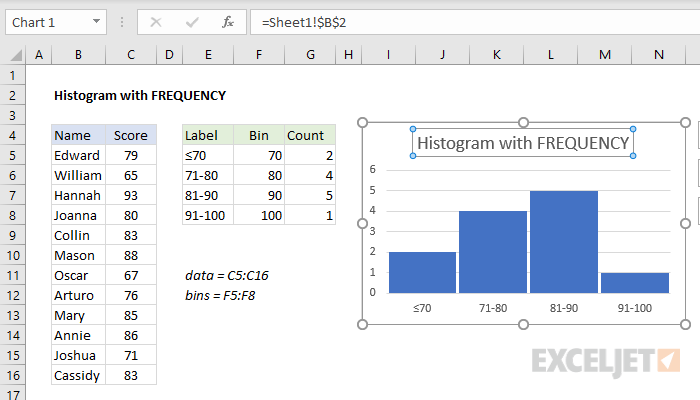
Final chart showing values plotted:
Histogram with Data Analysis ToolPak
Another way to create a histogram in Excel is to use the Data Analysis ToolPak add-in. This is a very simple method, and it works in older versions of Excel. However, one limitation is that the output is static, and won't update automatically if values in the data change.