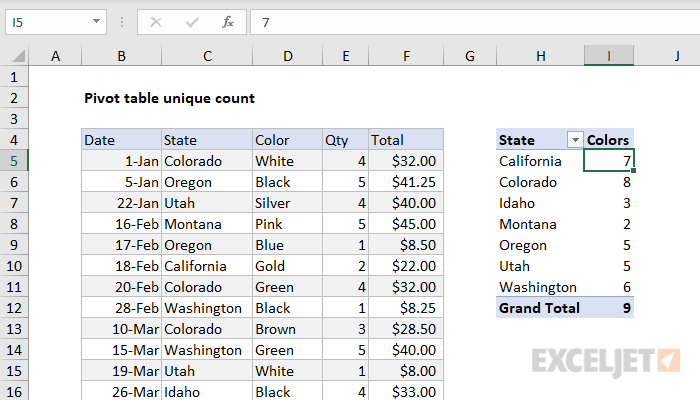
By default, a Pivot Table will count all records in a data set. To show a unique or distinct count in a pivot table, you must add data to the object model when the pivot table is created. In the example shown, the pivot table displays how many unique colors are sold in each state.
Fields
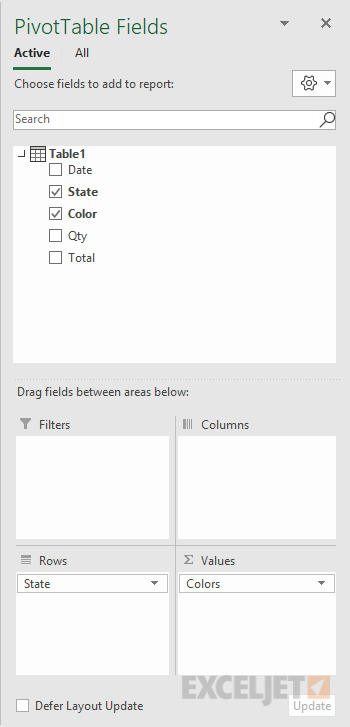
The pivot table shown is based on two fields: State and Color. The State field is configured as a row field, and the Color field is a value field, as seen below.
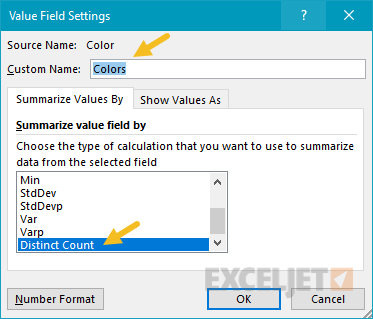
In the Pivot Table, the Color field has been renamed "Colors", and "Summarize values by" has been set to "Distinct count":
Data model
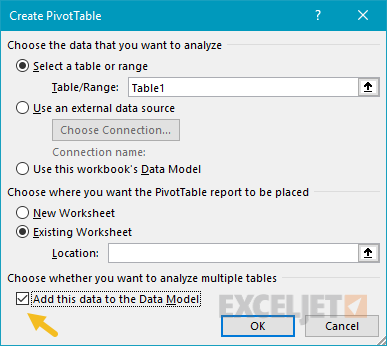
When the Pivot Table is created, the "Add this data to the Data Model" box is checked. This is what makes the distinct count option available.
Steps
- Create a pivot table, and tick "Add data to data model"
- Add State field to the rows area (optional)
- Add Color field to the Values area
- Set "Summarize values by" > "Distinct count"
- Rename Count field if desired
Notes
- Distinct count is available in Excel 2013 and later


