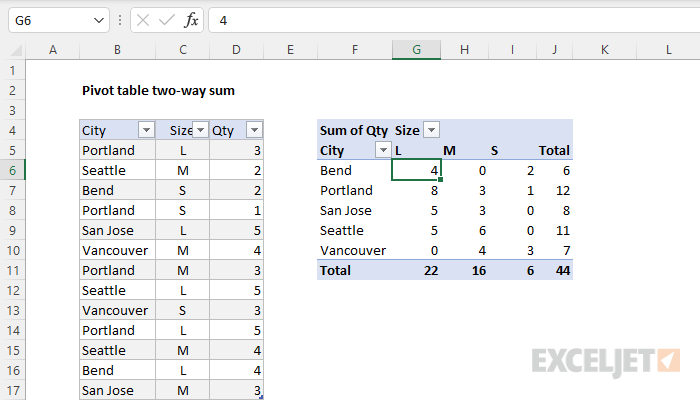
Pivot tables are an easy way to quickly sum unique values in a data set, and can easily be adapted to perform a two-way sum. In the example shown above, a pivot table is used to sum The Qty field for unique combinations of City and Size, based on data in the range B5:D17, defined as an Excel Table.
Fields
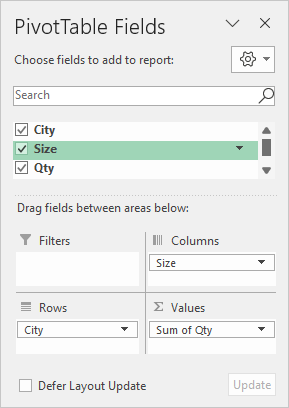
The pivot table shown is based on three fields: City, Size, and Qty. The City field is added as a Row field, and the Size field is added as a Column field. The Qty field is added as a Value field:
The Qty field in the Values area is configured to Sum:
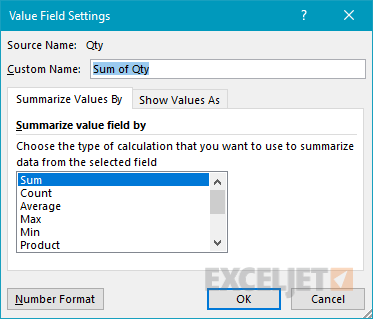
By default, the Pivot Table automatically sums values in the Qty field, so there is no need to change the calculation in this case.
Steps
- Define data as an Excel Table (optional)
- Create a pivot table based on a table (or data)
- Add the City field to the Rows area
- Add the Size field to the Columns area
- Add the Qty field to the Values area
Notes
- When a numeric field is added as a Value field, Excel the field is automatically summed.


