=VARPA(number1, [number2], ...)- number1 - First number or reference.
- number2 - [optional] Second number or reference.
Using the VARPA function
The VARPA function calculates the variance for data that represents an entire population. Variance provides a general idea of the spread of data. The difference between the VARPA function and the VARP function is in how these functions handle logical values and numbers as text. The VARP function will ignore text values and logicals when the appear in references, while the VARPA function will evaluate text as zero, TRUE as 1, and FALSE as zero. Note that both VARP and VARPA will evaluate logical values, and numbers as text when they are hardcoded directly as arguments.
Example
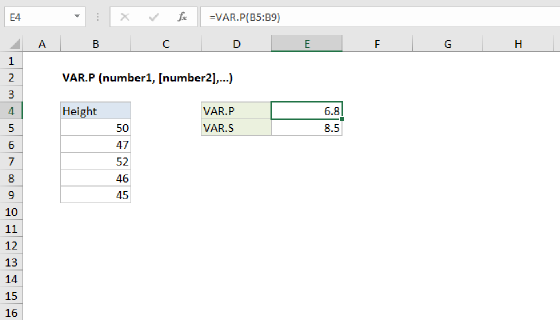
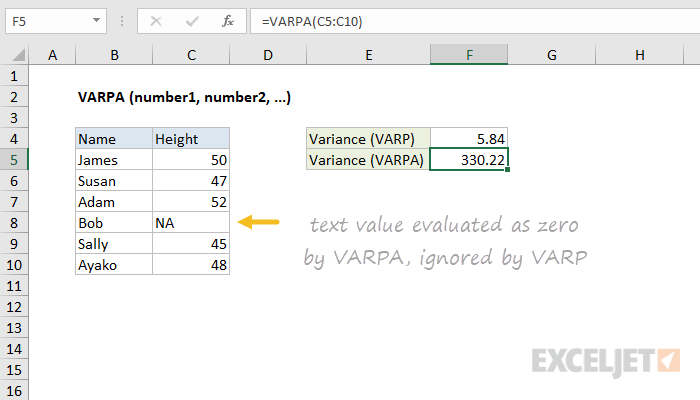
In the example shown, the formula in F5 is:
=VARPA(C5:C10)
Note that the VARP function ignores the "NA" text in C8, while VARPA includes this in the variance estimate as zero.
Variation functions in Excel
The table below summarizes the variation functions available in Excel.
| Name | Data set | Text and logicals |
|---|---|---|
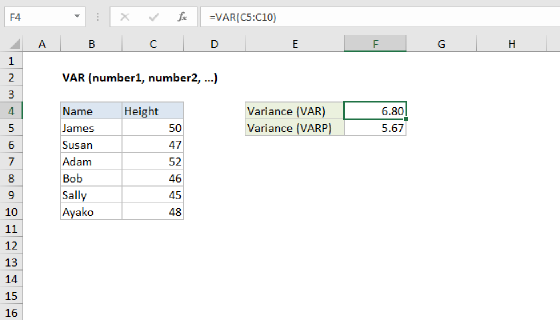
| VAR | Sample | Ignored |
| VARP | Population | Ignored |
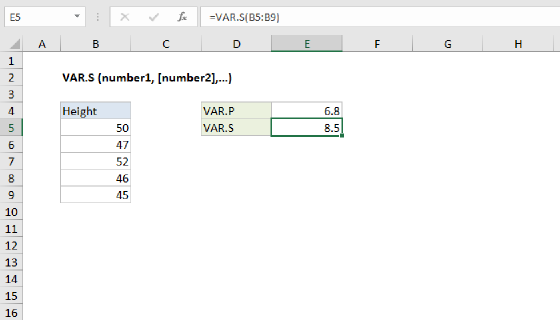
| VAR.S | Sample | Ignored |
| VAR.P | Population | Ignored |
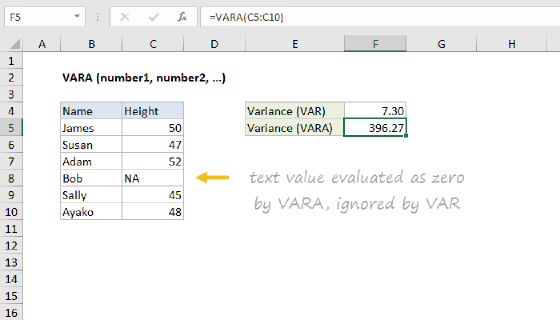
| VARA | Sample | Evaluated |
| VARPA | Population | Evaluated |
Notes
- VARPA assumes data represents the entire population. If data represents a sample, use VARA or VAR.S
- VARPA evaluates text values and logicals in references, unlike VARP.
- Arguments can either be numbers or names, arrays, or references that contain numbers.
- Arguments can be hard-coded values instead of references.
- To ignore logical values and/or text in references, use VARP or VAR.P