Summary
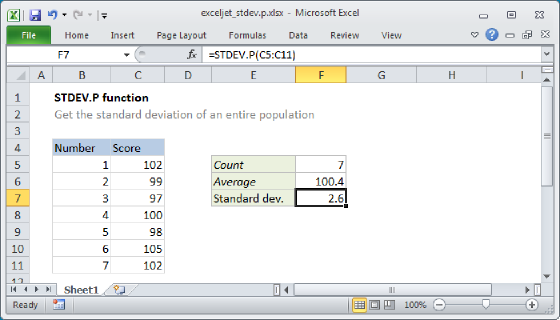
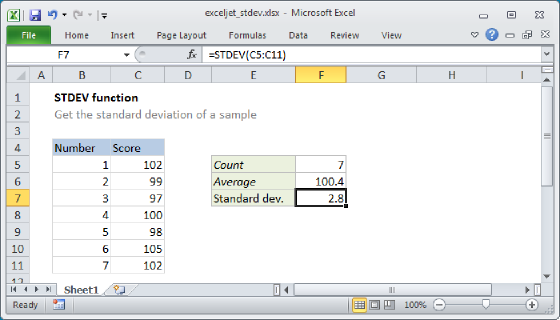
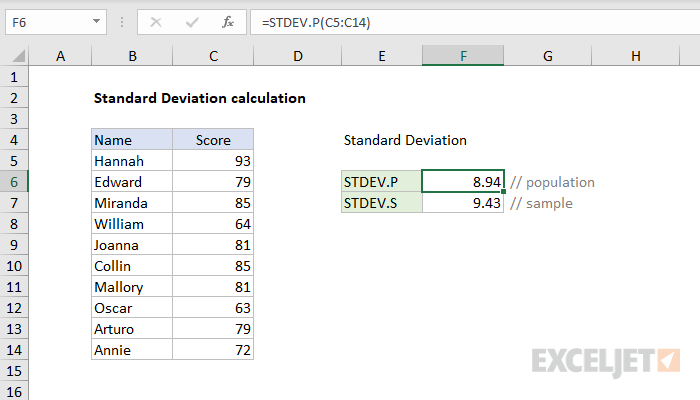
To calculate the standard deviation of a data set, you can use the STDEV.S or STDEV.P function, depending on whether the data set is a sample, or represents the entire population. In the example shown, the formulas in F6 and F7 are:
=STDEV.P(C5:C14) // F6
=STDEV.S(C5:C14) // F7
Explanation
Standard deviation in Excel
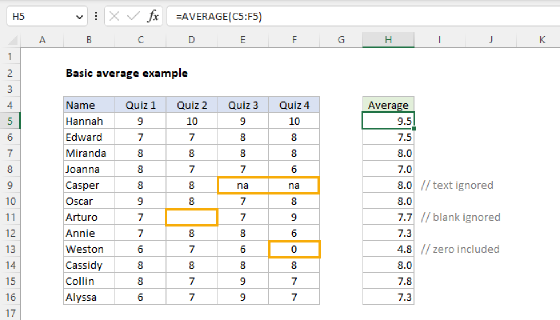
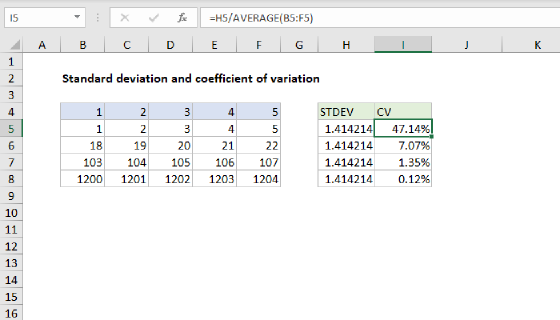
Standard deviation is a measure of how much variance there is in a set of numbers compared to the average (mean) of the numbers. To calculate standard deviation in Excel, you can use one of two primary functions, depending on the data set. If the data represents the entire population, you can use the STDEV.P function. IF the data is just a sample, and you want to extrapolate to the entire population, you can use the STDEV.S function to correct for sample bias as explained below. Both functions are fully automatic.
Bessel’s correction, STDEV.P vs. STDEV.S
When you calculate statistics for an entire population (mean, variance, etc.) results are accurate because all data is available. However, when you calculate statistics for a sample, results are estimates and therefore not as accurate.
Bessel's correction is an adjustment made to correct for bias that occurs when working with sample data. It appears in formulas as n-1, where n is the count. When working with a sample population, Bessel's correction can provide a better estimation of the standard deviation. In the context of Excel and standard deviation, the key thing to understand is:
- The STDEV.S function uses Bessel's correction
- The STDEV.P function does not
When should you use STDEV.S, which includes Bessel’s correction? It depends.
- If you have data for an entire population, use STDEV.P
- If you have an appropriately large sample and you want to approximate standard deviation for the entire population, use the STDEV.S function.
- If you have sample data, and only want standard deviation for the sample, without extrapolating for the entire population, use the STDEV.P function.
Remember that a small sample is not likely to be a good approximation of a population in most cases. On the other hand, a large enough sample size will approach the statistics produced for a population. In these cases, Bessel’s correction may not be useful.
Manual calculations for standard deviation
The screen below shows how to manually calculate standard deviation in Excel.
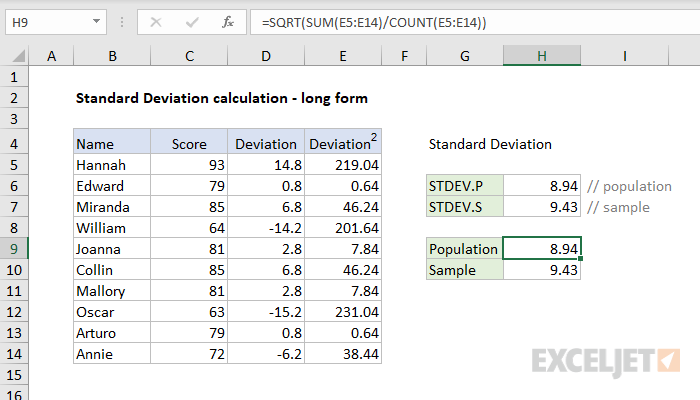
Column D calculates Deviation, which the value minus mean. The formula in D5, copied down is:
=C5-AVERAGE($C$5:$C$14)
Column E shows deviations squared. The formula in E5, copied down is:
=(D5)^2
In H5 we calculate standard deviation for the population with this formula:
=SQRT(SUM(E5:E14)/COUNT(E5:E14))
In H6 we calculate standard deviation for a sample with a formula that uses Bessel’s correction:
=SQRT(SUM(E5:E14)/(COUNT(E5:E14)-1))
Older functions
You may notice that Excel contains older functions, STDEVP and STDEV which also calculate standard deviation. In short:
- STDEV.P replaces the STDEVP function, with identical behavior.
- STDEV.S replaces the STDEV function, with identical behavior.
Although STDEVP and STDEV still exist for backwards compatibility, Microsoft recommends that people use the newer STDEV.P and STDEV.S functions instead.