Summary
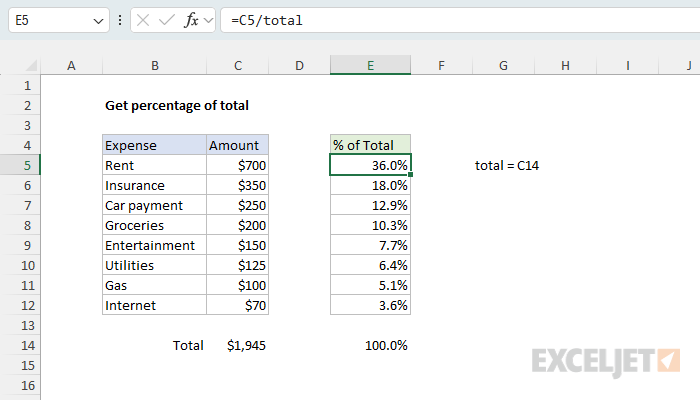
To calculate the percent of a total (i.e. calculate a percent distribution), you can use a formula that simply divides a given amount by the total. In the example shown, the formula in E5, copied down, is:
=C5/total
where total is the named range C14. The results are decimal values formatted with the Percentage number format to show 36%, 18%, etc. When the part and the whole are in the same row, as with attendance or percent sold, see Part and whole in the same row below.
Generic formula
=amount/total
Explanation
In this example, the goal is to work out the "percent of total" for each expense shown in the worksheet. In other words, given that we know the total is $1,945, and we know Rent is $700, we want to determine that Rent is 36% of the total.
Divide the amount by the total
To calculate the percent of total for a given expense, we divide the amount of the expense by the total of all expenses. The total is in cell C14, which contains a formula based on the SUM function:
=SUM(C5:C12)
Cell C14 is also the named range total, so the formula in E5, copied down, is:
=C5/total // returns 0.3599
In cell E5, the ratio is 700/1945, which is approximately 0.36. Excel returns this as a decimal value, and the Percentage number format displays it as 36%.
Without the named range, we need to use an absolute reference to "lock" the address to C14 so the reference doesn't change as the formula is copied down column E. The formula becomes:
=C5/$C$14 // returns 0.3599
As the formula is copied down, we get a percent of total for each item shown in the table. Because every expense is divided by the same total, the percentages add up to 100%, as the SUM in E14 confirms.
Part and whole in the same row
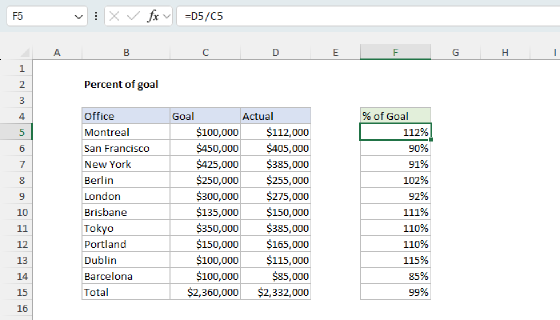
Often, each row has its own total: units sold out of units in stock, tasks done out of tasks assigned, students present out of students enrolled. In the worksheet below, the goal is to calculate attendance for each class, where column C holds the number of students and column D the number present. The formula in F5, copied down, is:
=D5/C5
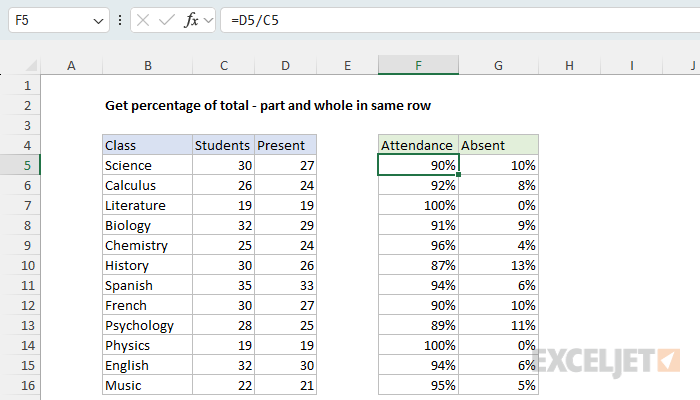
Because the whole is in the same row as the part, the reference to C5 is relative and changes as the formula is copied down. No absolute reference is needed. In F5, the result is 27/30, or 90%. The same formula calculates percent sold: if 108 of 144 apples were sold, =108/144 returns 0.75, or 75%.
To calculate the percentage of students absent, subtract the number present from the total, then divide by the total. The formula in G5 is:
=(C5-D5)/C5 // returns 0.1
The parentheses make Excel subtract before it divides. Since attendance and absence together make 100%, =1-D5/C5 returns the same result.
If the whole can be zero or empty, the division returns #DIV/0!. To return an empty string instead, test the whole first:
=IF(C5=0,"",D5/C5). Excel treats an empty cell as zero here, so the same test handles both. For other options, see How to fix the #DIV/0! error.
Percentage vs. number
To display a percentage in Excel, use the Percentage number format, which will automatically display a decimal value as a percentage. If you want instead a simple number without a percent sign, just multiply by 100:
=(C5/total)*100
=(C5/$C$14)*100
The result is a number like 36, 18, 12.9, etc.