Purpose
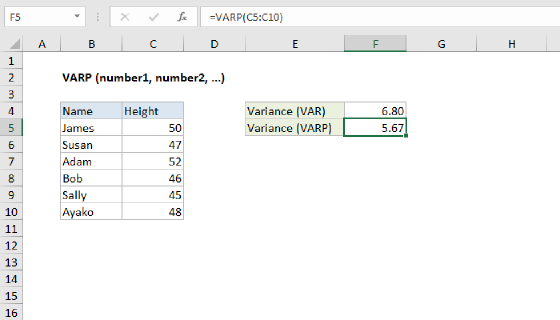
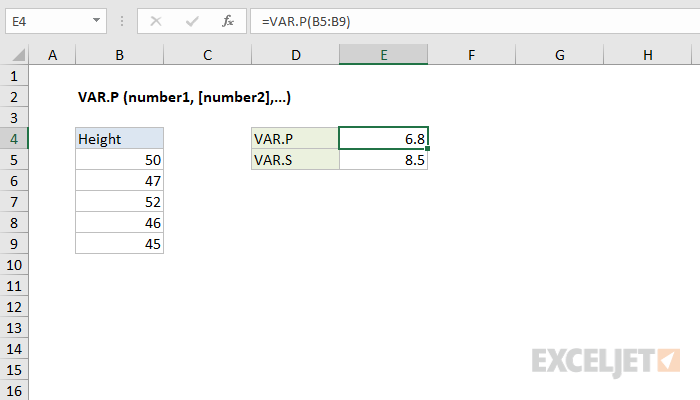
Get variation of population
Return value
Computed variance
Syntax
=VAR.P(number1, [number2], ...)- number1 - First number or reference.
- number2 - [optional] Second number or reference.
Using the VAR.P function
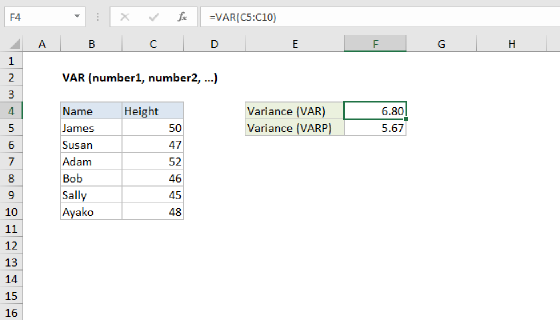
The VAR.P function calculates variance for data that represents an entire population. Variance measures how far a data set is spread out, giving you a general idea of the spread of your data. The VAR.P function can accept up to 254 arguments.
Variation functions in Excel
The table below summarizes the variation functions available in Excel.
| Name | Data set | Text and logicals |
|---|---|---|
| VAR | Sample | Ignored |
| VARP | Population | Ignored |
| VAR.S | Sample | Ignored |
| VAR.P | Population | Ignored |
| VARA | Sample | Evaluated |
| VARPA | Population | Evaluated |
Notes
- VAR.P assumes data represents the entire population. If data represents a sample, compute variance with VAR.S.
- VAR.P only evaluates numbers in references, ignoring empty cells, text, and logical values like TRUE or FALSE.
- Arguments can either be numbers or names, arrays, or references that contain numbers.
- Arguments can be hard-coded values instead of references.
- To evaluate logical values and/or text, use the VARPA function.