=SLOPE(known_ys, known_xs)- known_ys - An array or range of numeric data points (dependent values).
- known_xs - An array or range of numeric data points (independent values).
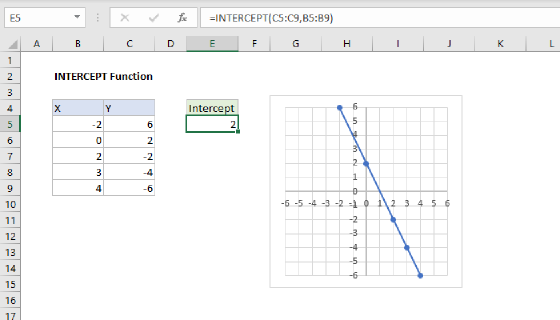
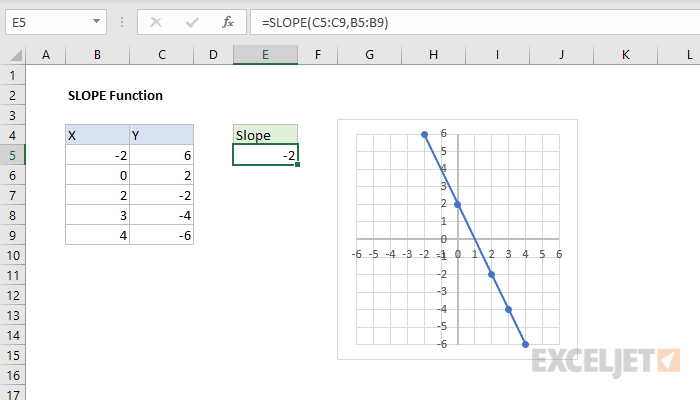
Using the SLOPE function
The SLOPE function returns the slope of a regression line based on known y values and known x values. A regression line is a "best fit" line based on known data points.
The slope of a line is a measure of steepness. Mathematically, slope is calculated as "rise over run", or change in y over the change in x. For example, if a line has a slope of 2/1 (2), then if y increases by 2 units, x increases by 1 unit.
Example
In the example shown, the formula in E5 is:
=SLOPE(B5:B9,C5:C9) // returns -2
This formula returns -2, based on known_ys in C5:C9, and known_xs in B5:B9.
Equation
In statistics, a best fit line does not normally lie exactly on the known x and y points. The equation used by the SLOPE function in Excel is based on the mean of known x's and y's:
For the example shown, this formula can be manually recreated like this:
=SUM((B5:B9-AVERAGE(B5:B9))*(C5:C9-AVERAGE(C5:C9)))/SUM((B5:B9-AVERAGE(B5:B9))^2)
The calculated result from the SLOPE function and the manual formula are the same.
Notes
- If there is only one set of points, SLOPE will return #DIV/0!
- If the count of known_ys is different from known_xs, SLOPE returns #N/A