=SKEW.P(number1, [number2], ...)- number1 - A range or reference that contains numeric values.
- number2 - [optional] A range or reference that contains numeric values.
Using the SKEW.P function
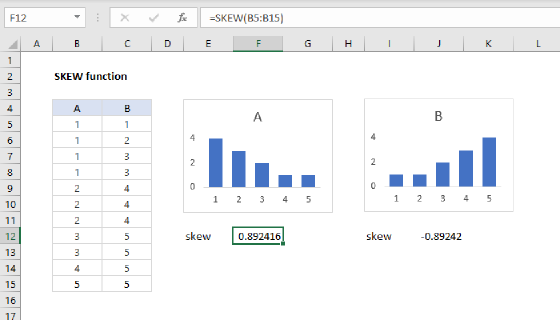
The SKEW.P function returns the "skewness" of a distribution. SKEW.P measures the symmetry of a distribution. A positive skew result indicates a distribution that tails off to the right. A negative skew result indicates a distribution that tails off to the left. In a perfectly symmetrical distribution, the skew is zero.
Example
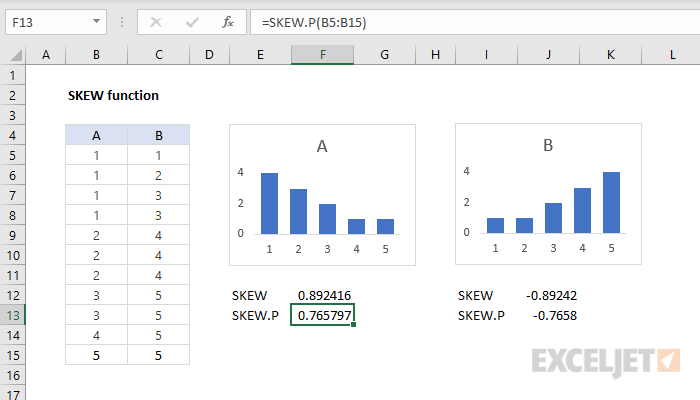
In the example shown, there are 11 numeric values in two groups, A and B. The count of values in each group are the inverse of each other. There are four 1's in group A, four 5's in group B, etc. The formula in cell F12 returns a positive skew:
=SKEW.P(B5:B15) // returns 0.7658
The formula in J12 returns a negative skew:
=SKEW.P(C5:C15) // returns -0.7658
Excel also contains the SKEW function, which measures sample skewness. The difference in calculation is related to an adjustment (n-1) made when data represents a sample versus the entire population. More details here.