Purpose
Return value
Syntax
=QUARTILE.INC(array,quart)- array - A reference containing data to analyze.
- quart - The quartile value to return.
Using the QUARTILE.INC function
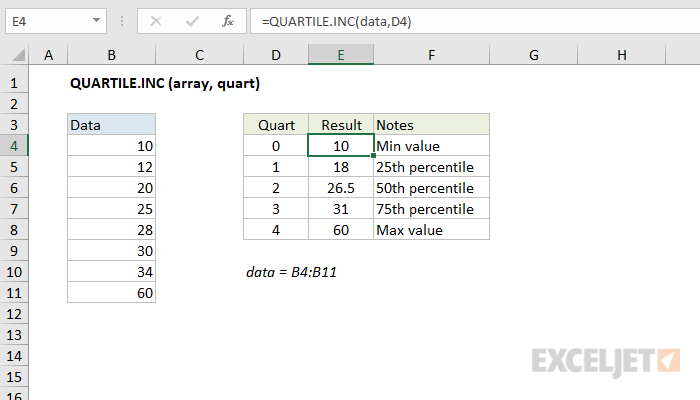
Use the QUARTILE.INC function to get the quartile for a given set of data. QUARTILE.INC takes two arguments, the array containing numeric data to analyze, and quart, indicating which quartile value to return. The QUARTILE function accepts 5 values for the quart argument, as shown in the table below.
| Quart | Return value |
|---|---|
| 0 | Min value |
| 1 | First quartile – 25th percentile |
| 2 | Median value – 50th percentile |
| 3 | Third quartile – 75th percentile |
| 4 | Max value |
QUARTILE.INC vs QUARTILE.EXC
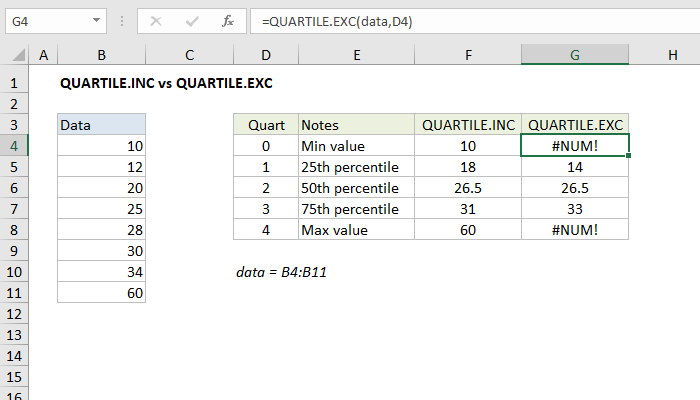
Percentiles can be defined as "greater than or equal to" (inclusive) or "greater than" (exclusive). The QUARTILE.INC function is inclusive and has "greater than or equal to" behavior. QUARTILE.EXC is exclusive, and has "greater than" behavior. The screen below shows how QUARTILE.INC and QUARTILE.EXC return different results for the same data. Note QUARTILE.EXC cannot be used to get the minimum or maximum value like QUARTILE.INC.

Note: Starting with Excel 2010, the QUARTILE.INC function replaces the QUARTILE function with the same behavior.


