=PERCENTILE(array, k)- array - Data values.
- k - Number representing kth percentile.
Using the PERCENTILE function
The Excel PERCENTILE function calculates the "kth percentile" for a set of data. A percentile is a value below which a given percentage of values in a data set fall. A percentile calculated with .4 as k means 40% percent of values are less than or equal to the calculated result, a percentile calculated with k = .9 means 90% percent of values are less than or equal to the calculated result.
To use PERCENTILE, provide a range of values and a number between 0 and 1 for the "k" argument, which represents percent. For example:
=PERCENTILE(range,.4) // 40th percentile
=PERCENTILE(range,.9) // 90th percentile
You can also specify k as a percent using the % character:
=PERCENTILE(range,80%) // 80th percentile
PERCENTILE returns a value greater than or equal to the specified percentile.
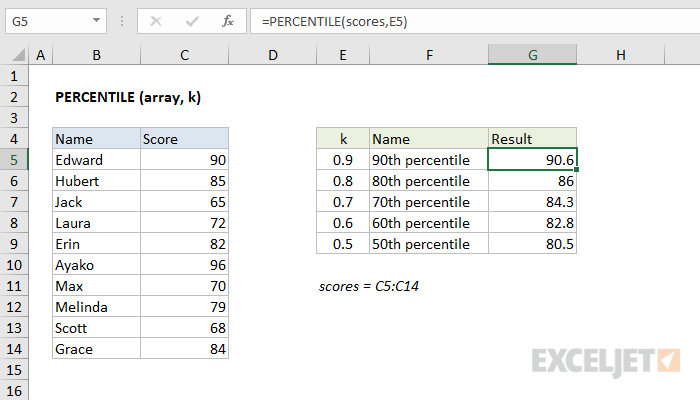
In the example shown, the formula in G5 is:
=PERCENTILE(scores,E5)
where "scores" is the named range C5:C14.
Note: Microsoft classifies PERCENTILE as a "compatibility function", now replaced by the PERCENTILE.INC function.
Notes
- k can be provided as a decimal (.5) or a percentage (50%)
- k must be between 0 and 1, otherwise PERCENTILE will return the #NUM! error.
- When percentiles fall between values, PERCENTILE will interpolate and return an intermediate value.