=INTERCEPT(known_ys, known_xs)- known_ys - An array or range of numeric data points (dependent values).
- known_xs - An array or range of numeric data points (independent values).
Using the INTERCEPT function
The INTERCEPT function returns the point at which a line will intersect the y-axis based on known x and y values. The intercept point is based on a regression line plotted with known x and y values. A regression line is a line that best fits that known data points. Use the INTERCEPT function to calculate the value of a dependent variable when the independent variable is zero (0).
The INTERCEPT function takes two arguments, known_ys and known_xs, which should be a range or array of numeric values. The known_ys represent dependent values and known_xs represent independent values. Both arguments must contain the same number values, or INTERCEPT will return #N/A.
Example
Values can be entered directly in INTERCEPT as array constants:
=INTERCEPT({2;0},{-1;1}) // returns 1
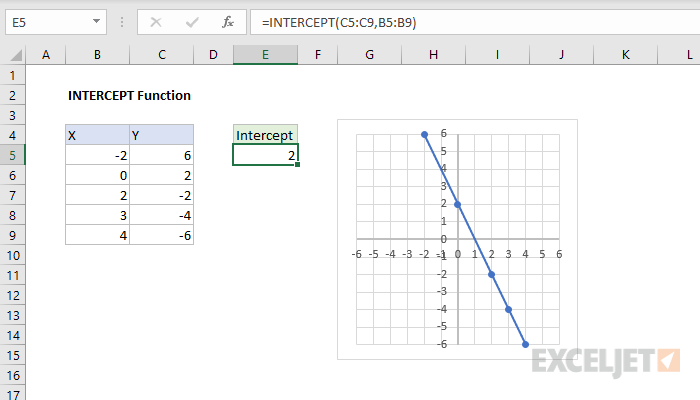
Typically, values are supplied as ranges. In the example shown, the formula in E5 is:
=INTERCEPT(C5:C9,B5:B9) // returns 2
This formula returns 2, based on known_ys in C5:C9, and known_xs in B5:B9.
Equation
The equation for the intercept of the regression line (a) is:
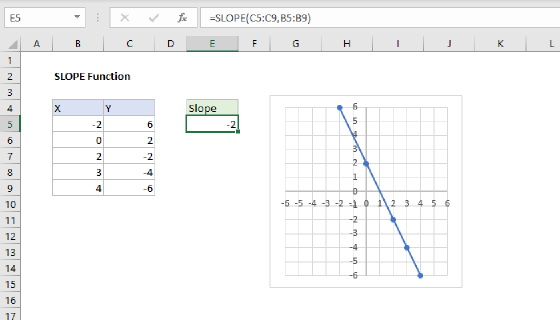
where b is the slope. The formula used by Excel to calculate slope is the same one used by the SLOPE function:
In the example shown, the intercept formula can be manually created like this:
=AVERAGE(C5:C9)-SLOPE(C5:C9,B5:B9)*AVERAGE(B5:B9)
This formula returns the same result as that returned by the INTERCEPT function.
Notes
- If there is only one set of points, INTERCEPT will return #DIV/0!
- If the count of known_ys is different from known_xs, INTERCEPT returns #N/A