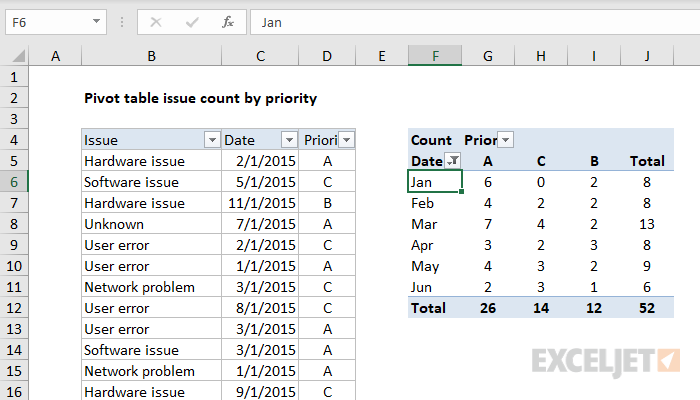
Pivot tables have a feature to group dates by year, month, and quarter. In the example shown, a pivot table is used to summarize support issues by month and by priority. Each row in the pivot table lists the count of issues recorded in a given month by priority (A, B, C). The Total columns shows the total count of issues recorded in each month.
Note: the source data contains data for an entire year, but the pivot table is filtered to show only the first 6 months of the year, January through June.
Fields
The source data contains three fields: Issue, Date, and Priority. All three fields are used to create the pivot table:
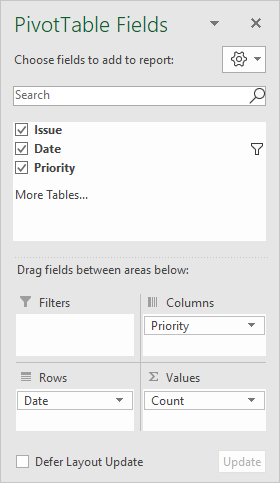
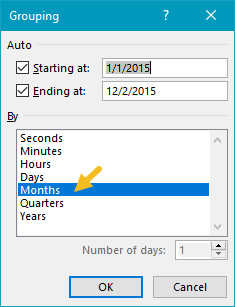
The Date field has been added as a Row field and grouped by month:
The Priority field has been added as a Column field.
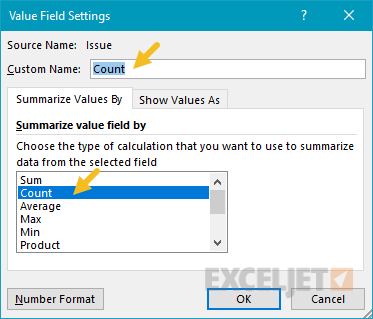
The Issue field has been added as a Value field and renamed "Count" for clarity. Because Issue contains text field, the calculation is automatically set to Count:
COUNTIFS alternative
As an alternative to a pivot table, you can use the COUNTIFS function to count by month, as seen in this example.
Steps
- Create a pivot table
- Add Date field to Rows area, group by Month
- Add Priority field to Columns area
- Add Issue field Values area, rename to "Count"
Notes
- Any non-blank field in the data can be used in the Values area to get a count.
- When a text field is added as a Value field, Excel will display a count automatically.
- Without a Row field, the count represents all data records.


