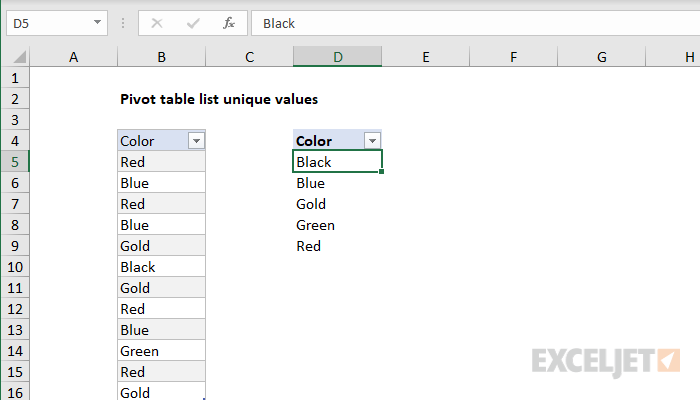
To extract a list of unique values from a data set, you can use a pivot table. In the example shown, the color field has been added as a row field. The resulting pivot table (in column D) is a one-column list of unique color values.
Data
The data in this pivot tables comes from the Excel Table in column B. Excel Tables are dynamic and will automatically expand and contract as values are added or removed. This allows the Pivot Table to always show the latest list of unique values (after refresh).
Fields
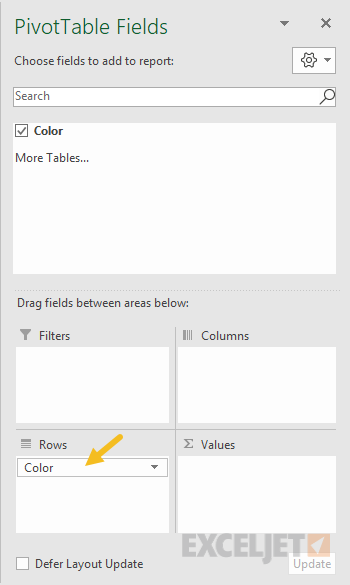
The pivot table shown in the example has just one field in the row area, as seen below.
Steps
- Define an Excel Table (optional)
- Create a Pivot Table (Insert > Pivot Table)
- Add the color field to the Rows area
- Disable Grand Totals for rows and columns
- Change layout to Tabular (optional)
- When data changes, Refresh pivot Table for latest list.


