=TBILLEQ(settlement, maturity, discount)- settlement - Settlement date of the security.
- maturity - Maturity date of the security.
- discount - Discount rate of the security.
Using the TBILLEQ function
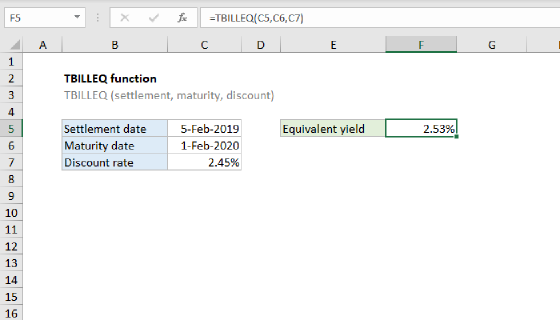
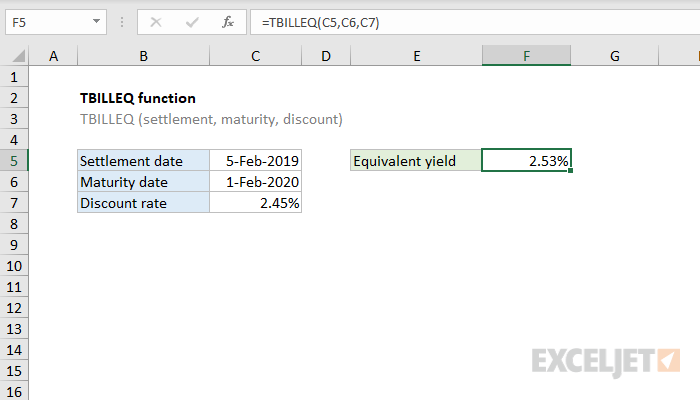
The Excel TBILLEQ function returns the bond-equivalent yield for a Treasury bill, based on a settlement date, a maturity date, and a discount rate. In the example shown, the settlement date is 5-Feb-2019, the maturity date is 1-Feb-2020, and the discount rate is 2.54%. The formula in F5 is:
=TBILLEQ(C5,C6,C7)
With these inputs, the TBILLEQ function returns a yield of 2.53%, with percentage number format applied.
Entering dates
In Excel, dates are serial numbers. Generally, the best way to enter valid dates is to use cell references, as shown in the example. To enter valid dates directly inside a function, the DATE function is the best option.
About treasury bills
A treasury bill (also called a T-Bill) is a short-term debt obligation issued by the US Treasury Department. T-Bills are sold in increments of $100, and have terms that range from a few days up to 52 weeks. Backed by US government, T-Bills are considered a low risk investment.
T-Bills are typically sold at a discount from par amount (face value), and the discount rate is determined at auction. However, T-bills can also be sold at a premium, when the price is greater than the par amount.
T-Bills do not offer regular interest payments like a coupon bond. However, when a T-Bill matures, the owner is paid it's par amount, or face value. When the par value is greater than the purchase price, the difference is the interest earned.