=FORECAST.ETS.STAT(values, timeline, statistic_type, [seasonality], [data_completion], [aggregation])- values - Existing or historical values (y values).
- timeline - Numeric timeline values (x values).
- statistic_type - The statistic to return, a numeric value between 1 and 8 (see table below).
- seasonality - [optional] Seasonality calculation (0 = no seasonality, 1 = automatic, n = season length in timeline units).
- data_completion - [optional] Missing data treatment (0 = treat as zero, 1 = average). Default is 1.
- aggregation - [optional] Aggregation behavior. Default is 1 (AVERAGE). See other options below.
Using the FORECAST.ETS.STAT function
The FORECAST.ETS.STAT function returns a given statistical value related to time series forecasting. The statistic_type argument determines which statistic is returned by FORECAST.ETS.STAT.
The FORECAST.ETS.STAT function is (optionally) used to output forecast statistics as part of the "Forecast sheet" feature in Excel. These are statistics relevant to the forecast created by the feature, which relies on the FORECAST.ETS function.
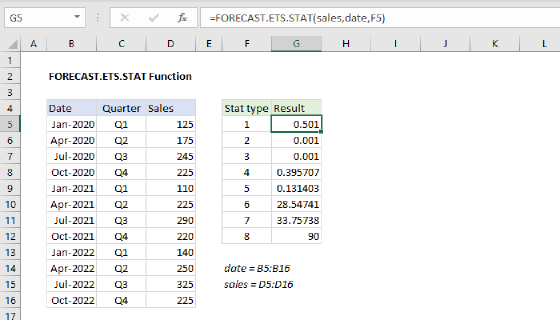
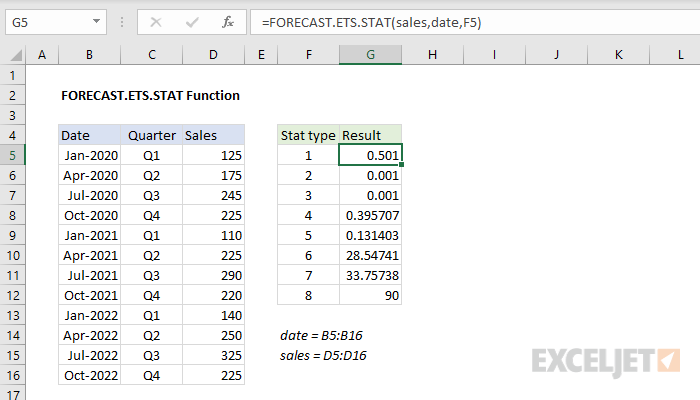
In the example shown above, the FORECAST.ETS.STAT function has been inserted manually to output all eight available forecast statistics based on the historical data and timeline shown. The statistic_type values come from column F*.*
Statistical values
The statistical value to return is determined by the statistic_type argument. The table below shows the eight possible values and corresponding results.
| Value | Result | Description |
|---|---|---|
| 1 | Alpha | The base parameter of the ETS algorithm. Higher values give more weight to recent data. |
| 2 | Beta | The trend parameter of the ETS algorithm. Higher values give more weight to recent trends. |
| 3 | Gamma | The seasonality parameter of the ETS algorithm. Higher values give more weight to recent seasonal periods. |
| 4 | MASE | The mean absolute scaled error metric, a measure of forecast accuracy. |
| 5 | SMAPE | The symmetric mean absolute percentage error metric, a measure of accuracy base on percentage errors. |
| 6 | MAE | The symmetric mean absolute percentage error metric, a measure of accuracy based on percentage errors. |
| 7 | RMSE | The root mean squared error metric, a measure of the differences between predicted and observed values. |
| 8 | Step size | The step size detected in the historical data timeline. |
Argument notes
The values argument contains the dependent array or range of data, also called y values. These are existing historical values from which a prediction will be calculated.
The timeline argument is the independent array or range of values, also called x values. The timeline must consist of numeric values with a constant step interval. For example, the timeline could be yearly, quarterly, monthly, daily, etc. The timeline can also be a simple list of numeric periods. It is not required that the timeline be sorted.
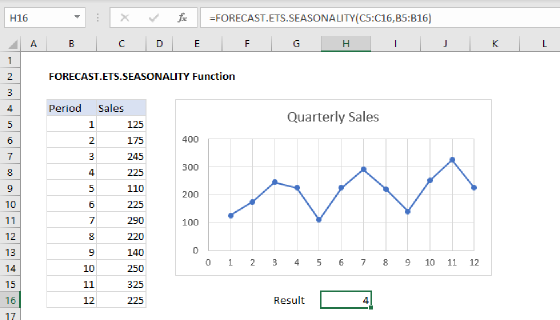
The seasonality argument is optional and represents the length of the seasonal pattern expressed in timeline units. For example, in the example shown, data is quarterly, so seasonality could be given as 4, since there are 4 quarters in a year, and the seasonal pattern is 1 year. Allowed values are 0 (no seasonality, use linear algorithm), 1 (calculate seasonal pattern automatically), and n (manual season length, a number between 2 and 8784, inclusive). The number 8784 = 366 x 24, the number of hours in a leap year.
The data_completion argument is optional and specifies how FORECAST.ETS should handle missing data points. The options are 1 (default) and zero. By default, FORECAST.ETS will provide missing data points by averaging neighboring data points. If zero is provided, FORECAST.ETS will treat missing data points as zero.
The aggregation argument is optional and controls what function is used to aggregate data points when the timeline contains duplicate values. The default is 1, which specifies AVERAGE. Other options are given in the table below.
| Value | Behavior |
|---|---|
| 1 (or omitted) | AVERAGE |
| 2 | COUNT |
| 3 | COUNTA |
| 4 | MAX |
| 5 | MEDIAN |
| 6 | MIN |
| 7 | SUM |
Errors
The FORECAST.ETS.STAT function will return errors as shown below.
| Error | Cause |
|---|---|
| #VALUE! | * seasonality is not numeric * data_completion is not numeric * aggregation is not numeric |
| #N/A | * values and timeline are not the same size |
| #NUM | * A consistent step cannot be determined in timeline * All timeline values are the same * The value for statistic_type is not within 1-8 * The value for seasonality is not within 0-8784 * The value for data_completion is not 0 or 1 * The value for aggregation is not within 1-7 |