=COVAR(array1, array2)- array1 - The first set of data values.
- array2 - The second set of data values.
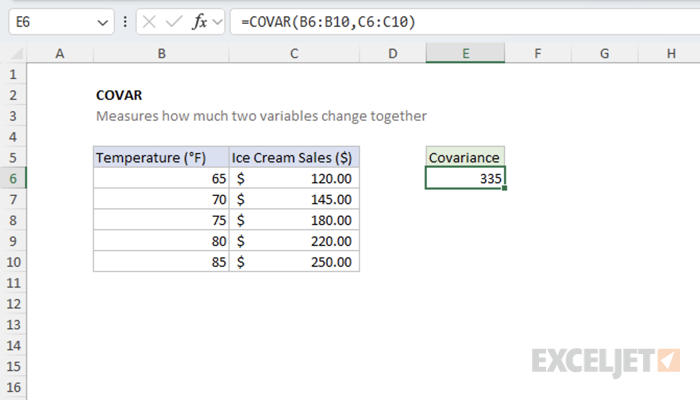
Using the COVAR function
The COVAR function calculates the population covariance between two data sets. It measures the degree to which two variables vary together, providing insight into their linear relationship. The return value from the function is a single number that can be positive, negative, or zero, depending on the relationship between the variables. Unlike correlation, covariance is not standardized and depends on the units of measurement.
Key features
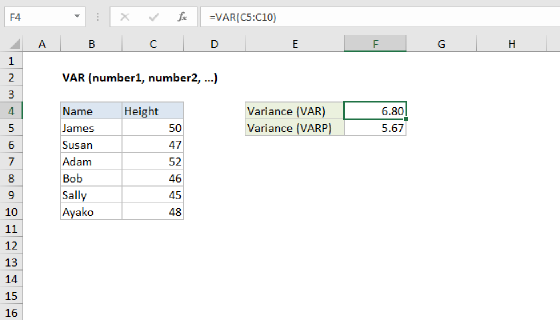
- Calculates population covariance (divides by N, not N-1)
- Both arrays must have the same number of data points
- Returns positive values when variables move together
- Returns negative values when variables move in opposite directions
- Returns values close to zero when variables are independent
- Works with numbers only - text and logical values are ignored
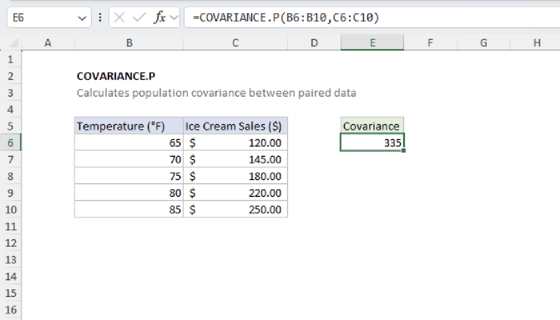
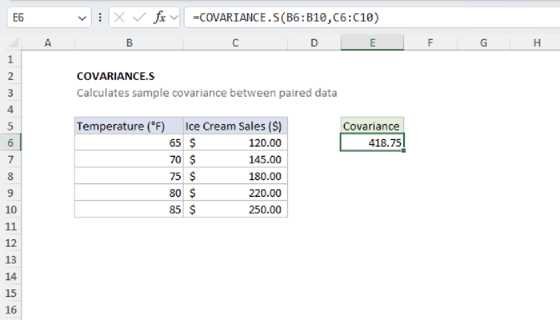
Note: Excel also provides COVARIANCE.P (population) and COVARIANCE.S (sample) functions in newer versions. COVAR is equivalent to COVARIANCE.P.
Table of contents
- Example #1 - Positive Covariance
- Example #2 - Negative Covariance
- Example #3 - Zero Covariance
- When to use COVAR
Example #1 - Positive Covariance
In this example, we'll examine the relationship between temperature (°F) and ice cream sales ($). As temperature increases, ice cream sales tend to increase as well, demonstrating positive covariance.
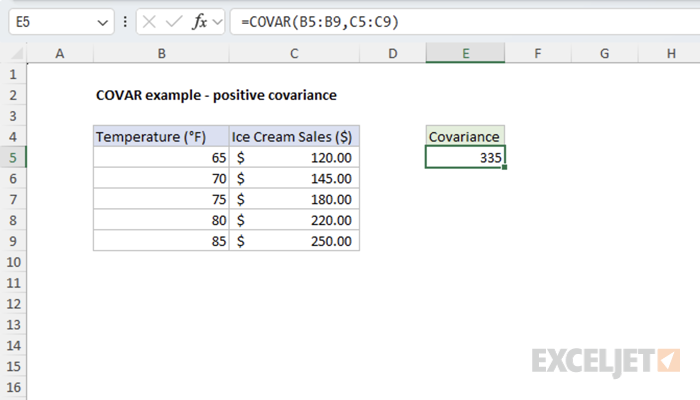
=COVAR(B5:B9,C5:C9) // returns 335
The positive result indicates that temperature and ice cream sales have a positive relationship. As one increases, the other increases too.
Example #2 - Negative Covariance
Here we examine the relationship between a car's mileage and its resale price. As mileage increases, the car's value typically decreases, showing negative covariance.
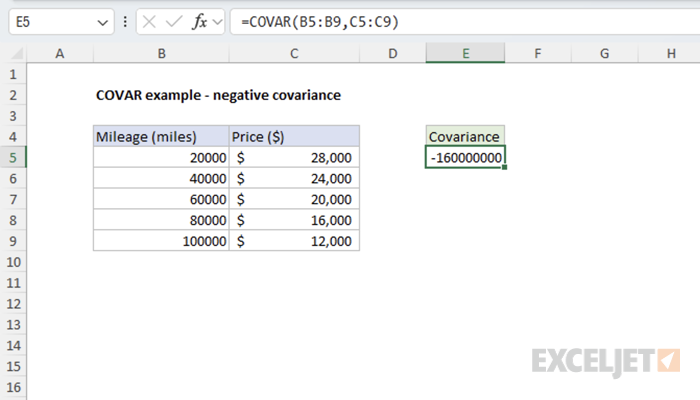
=COVAR(B5:B9,C5:C9) // returns -160000000
The negative result confirms that mileage and car price have an inverse relationship. As one increases, the other decreases.
Example #3 - Zero Covariance
This example illustrates two variables with no linear relationship: daily temperature and the result of a dice roll. These variables are completely independent of each other.
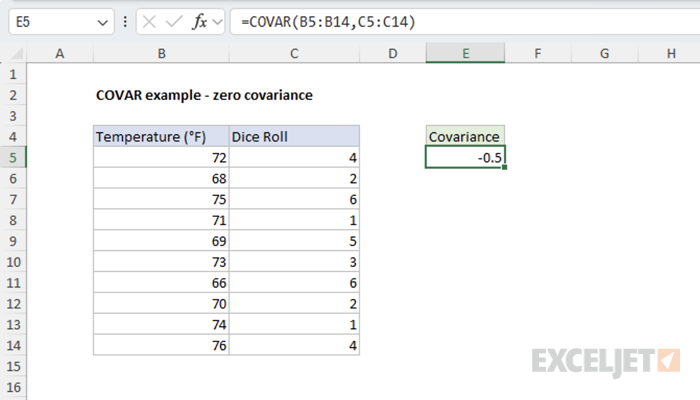
=COVAR(B5:B14,C5:C14) // returns -0.5
The result close to zero indicates no meaningful relationship between temperature and dice roll outcomes.
When to use COVAR
Use the COVAR function when you need to analyze paired data to understand whether a relationship exists between the two variables. A positive covariance indicates that the two variables tend to move in the same direction. A negative covariance suggests that the variables move in opposite directions. If the result is near zero, it implies there is little to no linear relationship between the two data sets.
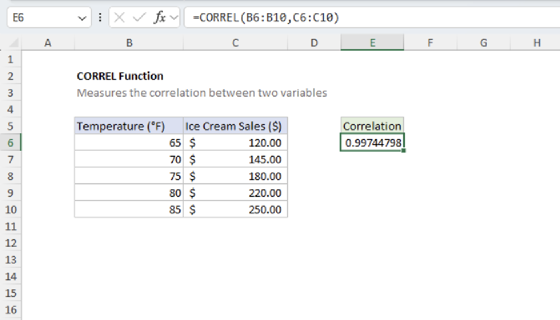
The magnitude of the covariance depends on the units of measurement. As a result, it can be challenging to determine the strength of a relationship between two variables from covariance alone. When you care about the magnitude of change between variables, COVAR might be the appropriate function for your use case. Otherwise, for a standardized comparison, use the correlation function instead.
Formula definition of COVAR
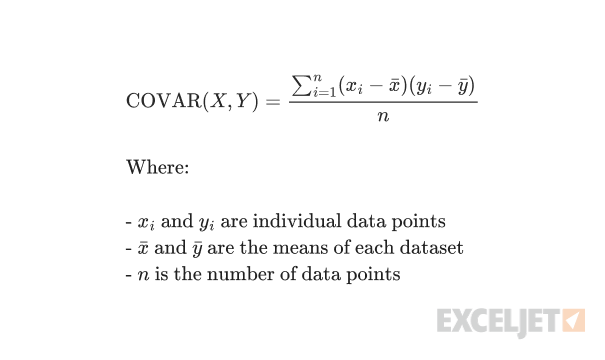
Notes
- Empty cells, text, and logical values are ignored
- Returns #DIV/0! error if arrays are empty after ignoring non-numeric values
- Returns #N/A error if arrays have different lengths
- For sample covariance (divides by N-1), use COVARIANCE.S function