Summary
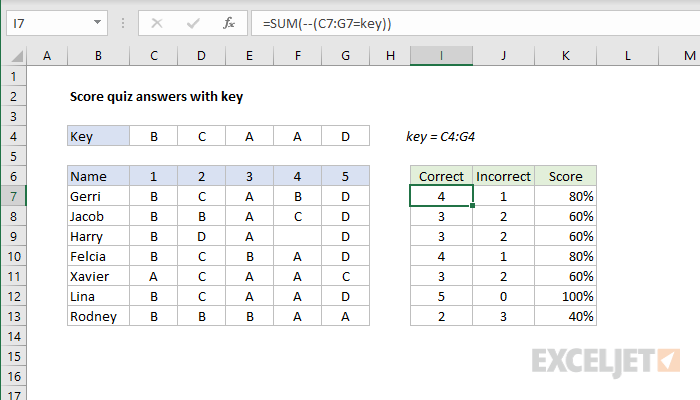
To score a quiz and count correct and incorrect answers based on an answer key, you can use a basic array formula. In the example shown, the formula in I7, copied down, is:
=SUM(--(C7:G7=key))
where key is the named range C4:G4.
Note: This is an array formula. In Excel 365, enter normally. In older versions of Excel, you must enter with control + shift + enter.
Generic formula
=SUM(--(answers=key))
Explanation
This formula uses the named range key (C4:G4) for convenience only. Without the named range, you'll want to use an absolute reference so the formula can be copied.
In cell I7, we have this formula:
=SUM(--(C7:G7=key))
working from the inside-out, this expression is evaluated first:
C7:G7=key // compare answers to key
The result is an array of TRUE FALSE values like this:
{TRUE,TRUE,TRUE,FALSE,TRUE}
TRUE values indicate a correct answer, FALSE values indicate an incorrect answer.
To coerce the TRUE and FALSE values to numbers, we use a double negative:
--({TRUE,TRUE,TRUE,FALSE,TRUE}) // get 1's and 0's
The is an array of 1's and 0's delivered directly to the SUM function:
=SUM({1,1,1,0,1}) // sum correct
The SUM function then returns the final result, 4.
Incorrect answers
The formula in J7 counts incorrect answers in almost the same way:
=SUM(--(C7:G7<>key))
The only difference is that we are now using the not equal to (<>) logical operator:
=SUM(--(C7:G7<>key))
=SUM(--({FALSE,FALSE,FALSE,TRUE,FALSE}))
=SUM({0,0,0,1,0})
=1
Percent correct
The formula in K7 calculates the percentage of correct answers like this:
=I7/COUNTA(key) // divide correct by total
Cell I7 already contains the count of correct answers. This is divided by the total count of quiz answers, which is calculated with the COUNTA function:
COUNTA(key) // count total
The result is formatted with the percentage number format.