Explanation
In this example, the goal is to look up and retrieve an entire column of values in a set of data. For example, when a value like "Q3" is entered into cell H4, all values in the range E5:E16 should be returned. For convenience and readability, quarter (C4:F4) and data (C5:F16) are named ranges.
Although this example shows off the simplicity of the XLOOKUP function, it can also be solved with a straightforward INDEX and MATCH formula, as described below.
With XLOOKUP
With the XLOOKUP function, the solution is straightforward. In the example shown, the formula in H5 is:
=XLOOKUP(H4,quarter,data)
Here, lookup_value is H4 (which contains "Q3"), lookup_array is quarter (C4:F4), and return_array is data (C5:F16). With this configuration, XLOOKUP matches the 3rd value in C4:F4, and returns the third column in C5:F16. In the dynamic array version of Excel, the 12 values in E5:E16 spill into the range H5:H16. If the value in H4 is changed to a different quarter, the formula will immediately recalculate and return a new column of values.
With FILTER
You might not think of using the FILTER function to filter columns, but it works fine. In this case, the formula to solve this problem is:
=FILTER(data,quarter=H4)
After the include argument is evaluated, we have an array of TRUE and FALSE values:
=FILTER(data,{FALSE,FALSE,TRUE,FALSE})
And FILTER returns the third column in data. For another example of using FILTER on horizontal data, see this page.
With INDEX and MATCH
This problem can also be solved with an INDEX and MATCH formula like this:
=INDEX(data,0,MATCH(N4,quarter,0))
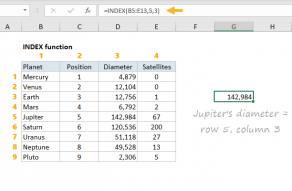
The gist of the solution is that the MATCH function is used to identify the column index, and the INDEX function will retrieve the entire column when row_num is set to zero(0). Working from the inside out, MATCH is used to get the column index like this:
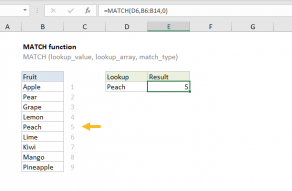
MATCH(H4,quarter,0) // returns 3
With "Q3" in H4, the MATCH function returns 3, since "Q3" is the third value in quarter (C4:F4). MATCH returns this result directly to the INDEX function as the col_num argument, with array set to data, and row_num set to 0:
=INDEX(data,0,3)
This causes INDEX to return all 12 values in the third column of data as a final result. In the dynamic array version of Excel, these results will spill into the range H5:H16. In Legacy Excel, you will need to enter this formula as a multi-cell array formula.
Processing with other functions
Often, the purpose of looking up and retrieving an entire column of values is to feed those values into another function like SUM, MAX, MIN, AVERAGE, LARGE, etc. This is simply a matter of nesting the lookup formula into another function. For example, you can get the sum, max, and average for Q3 like this:
=SUM(XLOOKUP(H4,quarter,data)) // get sum
=MAX(XLOOKUP(H4,quarter,data)) // get max
=AVERAGE(XLOOKUP(H4,quarter,data)) // get average
In each formula, the XLOOKUP returns all 12 values in the Q3 column to the outer function, which returns a single result. The same approach can be used with the INDEX and MATCH and FILTER versions of the formula.


