=NPV(rate, value1, [value2], ...)- rate - Discount rate over one period.
- value1 - First value(s) representing cash flows.
- value2 - [optional] Second value(s) representing cash flows.
Using the NPV function
NPV calculates the net present value (NPV) of an investment using a discount rate and a series of future cash flows. The discount rate is the rate for one period, assumed to be annual. NPV in Excel is a bit tricky, because of how the function is implemented. Although NPV carries the idea of "net", as in the present value of future cash flows less initial cost, NPV is really just the present value of uneven cash flows.
As Timothy R. Mayes, author of Financial Analysis with Microsoft Excel, says on his website TVMCalcs.com:
Net present value is defined as the present value of the expected future cash flows less the initial cost of the investment...the NPV function in spreadsheets doesn't really calculate NPV. Instead, despite the word "net," the NPV function is really just a present value of an uneven cash flow function.
One simple approach is to exclude the initial investment from the values argument and instead subtract the amount outside the NPV function.
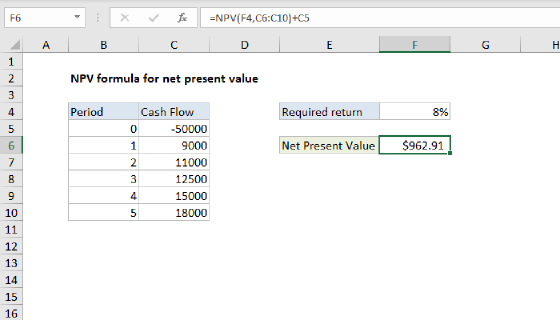
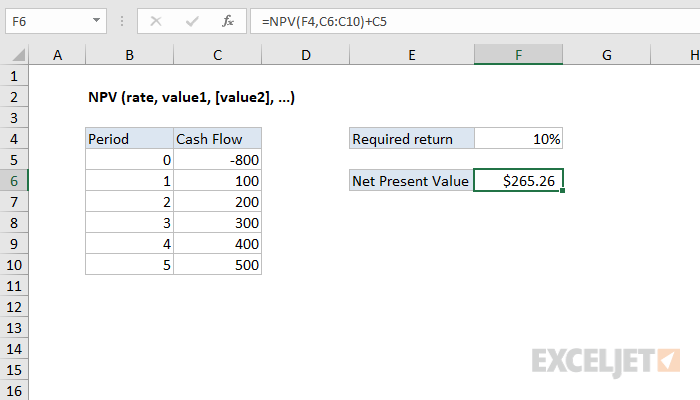
In the example shown, the formula in F6 is:
=NPV(F4,C6:C10)+C5
Note the initial investment in C5 is not included as a value, and is instead added to the result of NPV (since the number is negative).
Notes
- values must be equally spaced in time and occur at the end of each period.
- values must be in chronological order.