=LINEST(known_ys, [known_xs], [const], [stats])- known_ys - An array or range of dependent y values.
- known_xs - [optional] An array or range of independent x values.
- const - [optional] Boolean - normal or force the constant b to equal 0. Default is TRUE = normal calculation.
- stats - [optional] Boolean - return additional statistics. Default is FALSE = slope and intercept only.
Using the LINEST function
The LINEST function returns statistics for a best fit straight line through supplied x and y values. The values returned by LINEST include slope, intercept, standard error values, and more, up to 10 different statistics in total. To find the best fit of a line to the data, the LINEST function uses the "least squares" method, the standard approach in regression analysis.
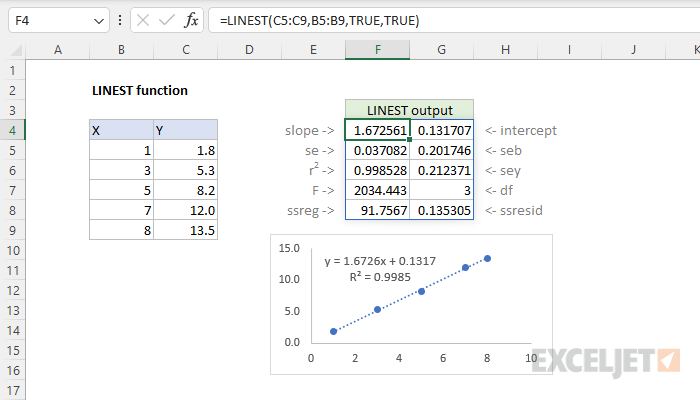
The LINEST function returns more than one value at a time in an array. In its most basic form, LINEST returns just intercept and slope. Optionally, LINEST can also return 10 separate statistics for the regression analysis as shown in the worksheet above. In Excel 365, which supports dynamic arrays, the array of values will spill into cells in the worksheet automatically. In other versions of Excel, you must enter the LINEST as a multi-cell array formula to see all values.
Available Statistics
The table below shows the statistics that can be returned by the LINEST function. Note the first two, slope and intercept are returned by default. The other statistics are returned by setting the stats argument to TRUE. When all statistics are returned, they are delivered in a 2D array, 5 rows by 2 columns. In the worksheet shown above, the range F4:G8 shows the order in which statistics are returned.
| Statistic | Description |
|---|---|
| slope | Slope coefficient |
| intercept | Intercept constant |
| se | Standard error of slope |
| seb | Standard error of intercept |
| r2 | Coefficient of determination |
| sey | Standard error of y estimate |
| F | F statistic (F-observed value) |
| df | Degrees of freedom |
| ssreg | Regression sum of squares |
| ssresid | Residual sum of squares |
Examples
By default, LINEST returns just two statistics, slope and intercept. For example:
=LINEST({1.8;5.3;8.2;12;13.5},{1;3;5;7;8}) // default
returns a 1 row by 2 column array like this:
{1.6726,0.1317}
Setting the stats argument to TRUE or 1 will cause LINEST to return all 10 statistics:
=LINEST({1.8;5.3;8.2;12;13.5},{1;3;5;7;8},TRUE,TRUE) // more stats
The result is an array with 5 rows and 2 columns:
{1.6726,0.1317;
0.0371,0.2017;
0.9985,0.2124;
2034.443,3;
91.7567,0.1353}
Note: values above have been rounded to make them easier to read.