=FORECAST(x, known_ys, known_xs)- x - The x value data point to use to calculate a prediction.
- known_ys - The dependent array or range of data (y values).
- known_xs - The independent array or range of data (x values).
Using the FORECAST function
The FORECAST function predicts a value based on existing values along a linear trend. FORECAST calculates future value predictions using linear regression, and can be used to predict numeric values like sales, inventory, test scores, expenses, measurements, etc.
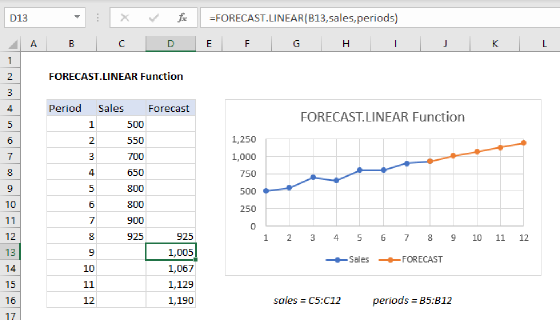
Note: Starting with Excel 2016, the FORECAST function was replaced with the FORECAST.LINEAR function. Microsoft recommends replacing FORECAST with FORECAST.LINEAR, since FORECAST will eventually be deprecated.
In statistics, linear regression is an approach for modeling the relationship between a dependent variable (y values) and an independent variable (x values). FORECAST uses this approach to calculate a y value for a given x value based on existing x and y values. In other words, for a given value x, FORECAST returns a predicted value based on the linear regression relationship between x values and y values.
Example
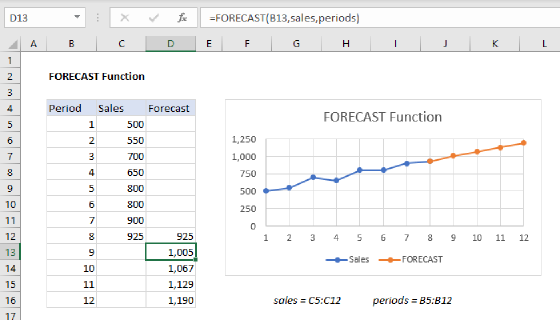
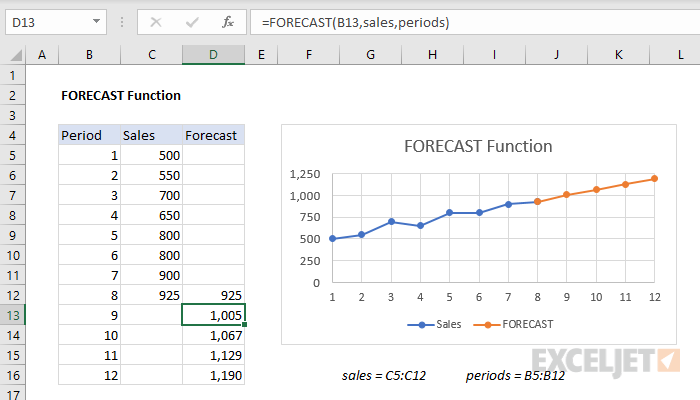
In the example shown above, the formula in cell D13 is:
=FORECAST(B13,sales,periods)
where sales (C5:C12) and periods (B5:B12) are named ranges. With these inputs, the FORECAST function returns 1505.36 in cell D13. As the formula is copied down the table, FORECAST returns predicted values in D13:D16, using values in column B for x.
The chart to the right shows this data plotted in a scatter plot.
Notes
- If x is not numeric, FORECAST returns a #VALUE! error.
- If known_ys and known_xs are not the same size, FORECAST will return an #N/A error.
- If the variance of known_x values is zero, FORECAST will return a #DIV/0! error.