Summary
A quick example of how to track testing for COVID-19 using Excel and publicly available data. In this project, the data is fetched and "shaped" with Power Query, then dropped back into Excel, where it can be refreshed with a single click.
![]()
Above: Tracking public COVID-19 testing data in Excel with Power Query
In this article, I want to share a quick example of how to track testing for COVID-19 using Excel and publicly available data. This is a bare bones tutorial, focused only on the basics of connecting Excel with publicly available data.
The end result is a simple Excel table that shows the most recent testing data by state. The data is fetched and "shaped" with Power Query, then dropped back into Excel, where it can be refreshed with a single click. The approach is general and can be used with all kinds of public data. The complete Excel file is attached below for reference.
The data
For this example, we're going to use data from the COVID tracking project website. The COVID Tracking Project collects data at the U.S. State level on testing for coronavirus, SARS-CoV-2. The data is not perfect, and varies state-by-state. You can read more about it on the website. The API for requesting data is explained here. In this example, we are fetching "States Current Values" data which, as of this writing contains 19 columns, most of which we discard.
Requirements
This project depends on Power Query, so you'll need Excel 2013 or later on Windows. On the Mac, you can refresh queries with Office 365 Excel, but I don't think you can edit or create queries yet? I'll update when I have better info.
Getting the data into Excel
The best tool for the job is Power Query. Power Query is part of Microsoft's BI suite. In a nutshell, Power Query is a tool for fetching, cleaning, and shaping data.
If you are new to Power Query, be aware that it has a vast feature set and an intimidating interface. Even if you spend a lot of time in Excel, you are going to feel like you've landed in an alien world. Familiar, yet distinctly different.
Never fear, we are going to keep things as simple as possible. There are many ways this example can be improved or embellished once you get things working.
High-level overview
To orient you, here are the high level steps we are going to perform:
- Create new excel workbook
- Create a new query to fetch data
- Edit query to shape data
- Load data back to Excel Table
- Add formulas as desired
The first two steps happen in Excel. The last two steps are done in power query. Once you have the query set up, you can right-click inside the table and select refresh. Fresh data will be collected, and the data will be shaped according to the steps defined in the query.
Steps to create the query
April 2 - the data for this project has been changing as more columns are tracked in the same file. The steps below need to be updated slightly, but the query in the attached Excel workbook is current.
These are the steps I used to create the query that fetches data from the tracking website.
-
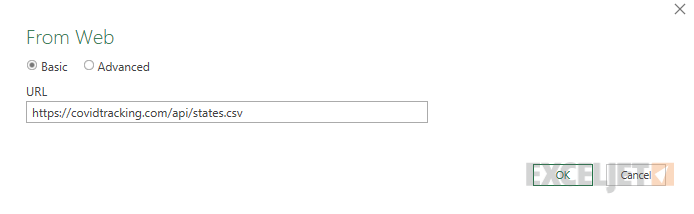
Click Data > Get Data > From web

-
Enter the url: https://covidtracking.com/api/states.csv and click OK
-
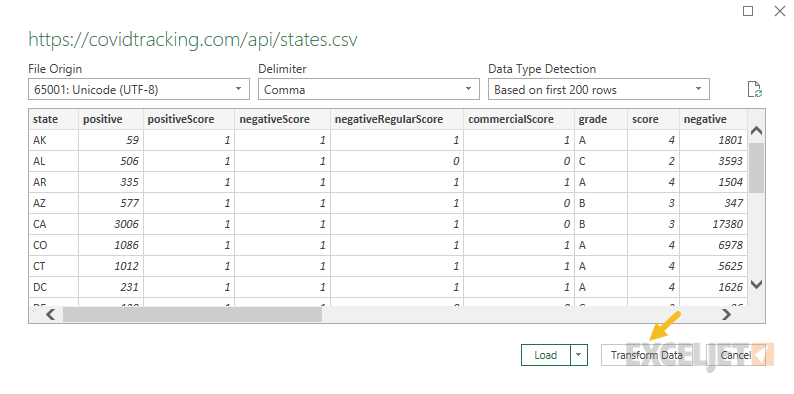
Click the Transform Data button to launch Power Query:
-
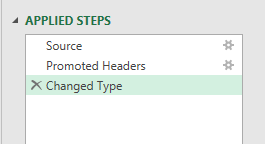
Power Query will automatically add three steps: Source, Promote Headers and Change type. If you select a step, you can see what it does.
-
Remove the automatic "Change Type" step. Hover and click on the "X" on the left. We will manually change type again below to make the query more resilient.
-
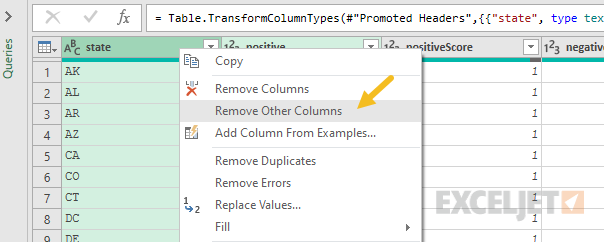
Control-click to select five columns: state, positive, death, dateModified, totalTestResults. Then, right-click on a select column and choose "Remove other columns".
-
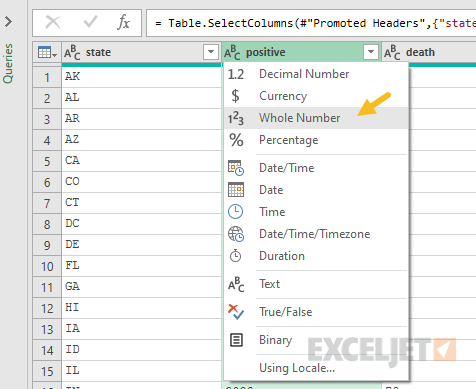
For each column select the "ABC", and Change Type: state (text), positive (whole number), death (whole number), dateModified (date time), totalTestResults (whole number).
-
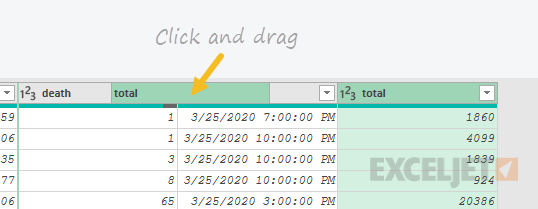
Drag to reorder columns: state, positive, death, dateModified, totalTestResults.
-
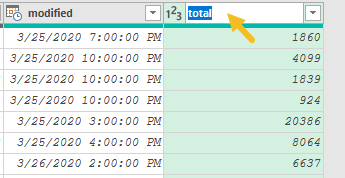
Rename columns to: state, positive, death, modified, total. Double-click header to rename columns.
-
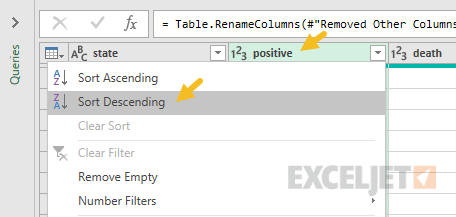
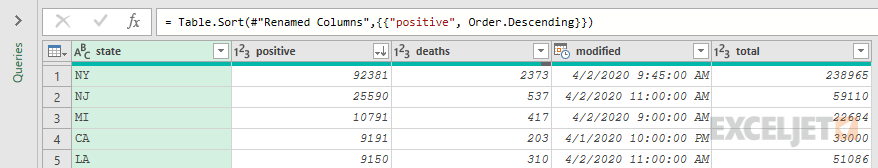
Sort data by the "positive" column in descending order.
-
Rename Query to "states":
-
Verify you have five columns of data like this:
-
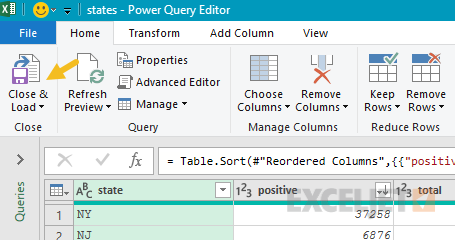
Click Close and Load button on Data tab of ribbon.
-
The data will end up in an Excel Table called "states"
Refreshing data
To fetch the latest data, right-click in the table and select "Refresh".
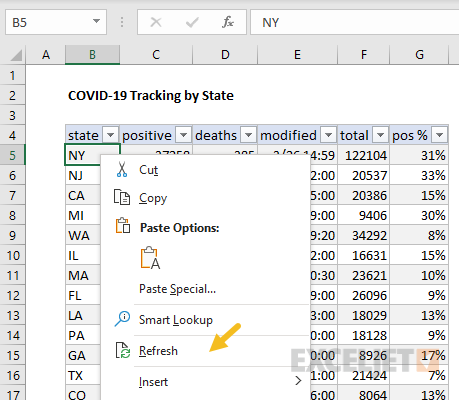
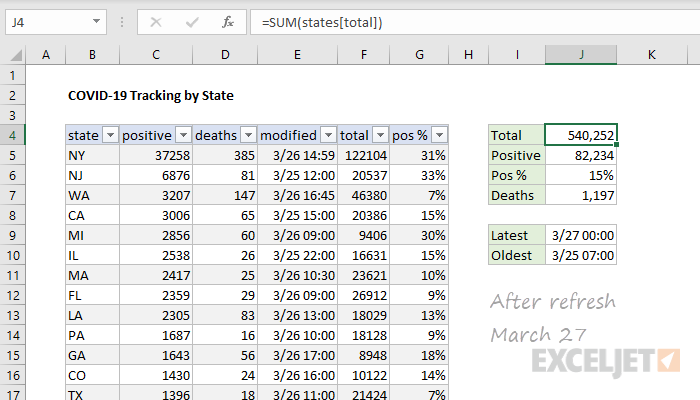
Power Query will pull down a fresh set of source data, run through the steps defined above, and deliver the result back to Excel. The screens below show the data on March 26 (before refresh, and March 27 (after refresh).
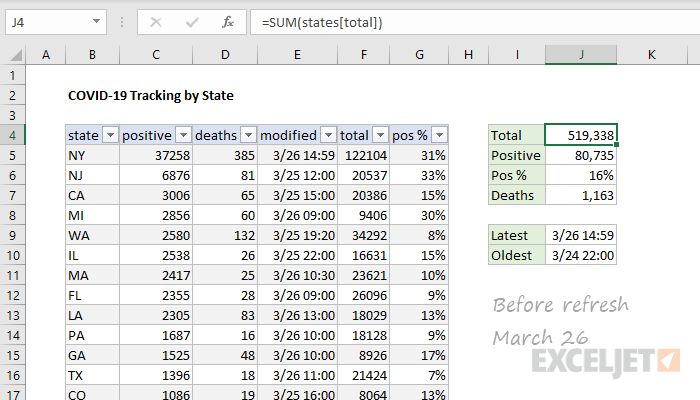
Back in Excel
Once the data is in an Excel table, I added a column called "pos %" that calculates what percentage of total tests are positive with this formula:
=[@positive]/[@total] // calculate percent positive
This is just something I was curious about. It could be added in Power Query instead (before loading to Excel) but to keep things simple, the formula was added manually in Excel. Since it lives in an Excel Table, it stays up to date when date changes.
Then I added formulas to summarize the data:
=SUM(states[total]) // J4
=SUM(states[positive]) // J5
=J5/J4 // J6
=SUM(states[deaths]) // J7
=MAX(states[modified]) // J9
=MIN(states[modified]) // J10
Note: most of these formulas use structured references, the formula syntax for Excel Tables.
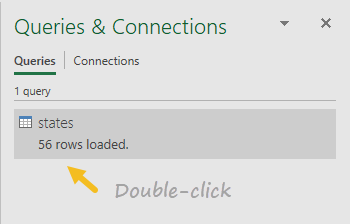
How to edit the query
-
Click Queries and Connections on the Data tab of the ribbon

-
Double click the "states" query to edit
More data
Here are a few more Coronavirus datasets with sample files you can try out.
Notes
- Many of the articles I've read about COVID-19 warn against focusing on testing only, because it can distract from the more serious problem, exponential spread of a contagious disease. To be clear, this article's only purpose is to show an example of how to get public data into Excel.
- I've posted more examples of Coronavirus datasets you can download in this article.


