
Summary
In this article, we look at how to use a pivot table to group voting data by age. This is a good example of the "group by number" feature that all pivot tables share.
Grouping data with pivot tables
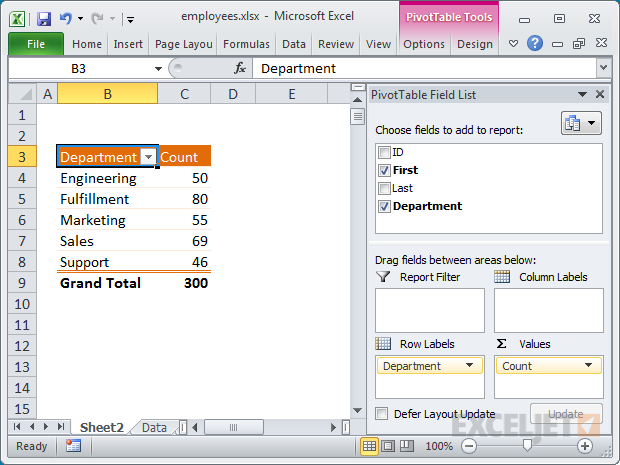
One of the most powerful features of pivot tables is their ability to group data. Any field added as a row or column label is automatically grouped by the values that appear in that field. For example, you might use a pivot table to group a list of employees by department. In this case, with the department field added as a row label, the pivot table neatly breaks out a count of employees by department, with a new row for each department that appears in the source data.
Voting results source data
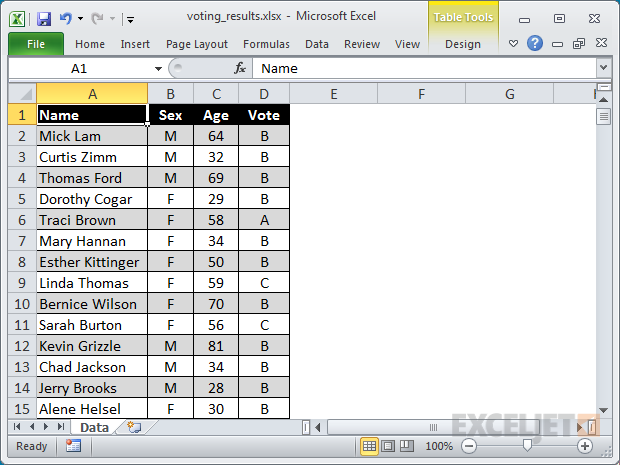
Many people stop with this basic automatic grouping, but pivot tables can also group data in more sophisticated ways. For example, you can also use a pivot table to group data by numbers – summarizing data by age range, price range, or any numerical range that makes sense for your data. To illustrate, let’s assume you have a list of voting results that includes voter age, and you want to summarize the results by age group. Your data might look something like this:
The basic pivot table
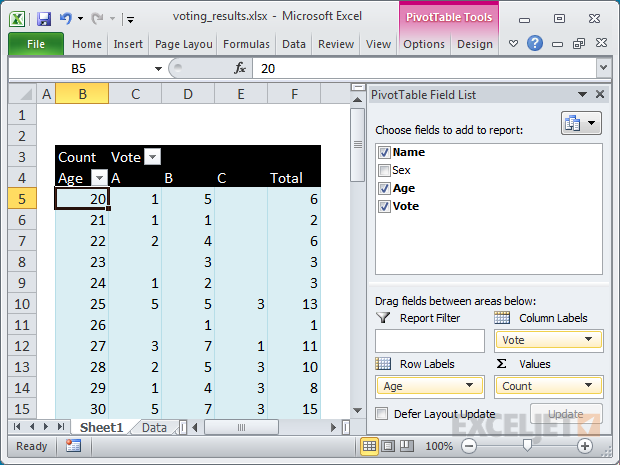
To get started grouping the data by age, first create your pivot table normally. Next, add the field Age as a Row Label, and the field Vote as a Column Label. Finally, add Name as a Value. In the example below, we also renamed Grand Total to Total. At this point, our pivot table looks like this:
Grouping by age
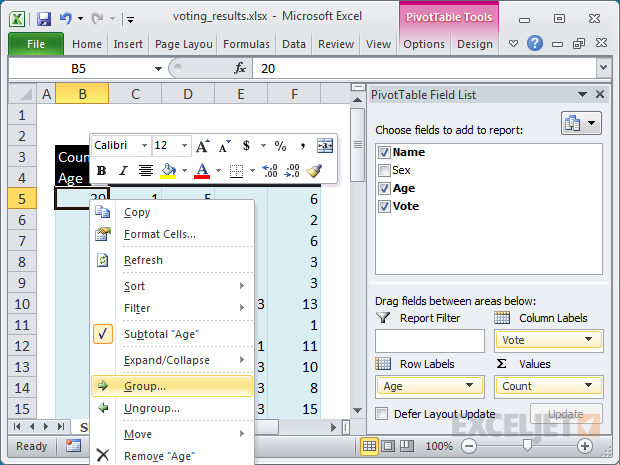
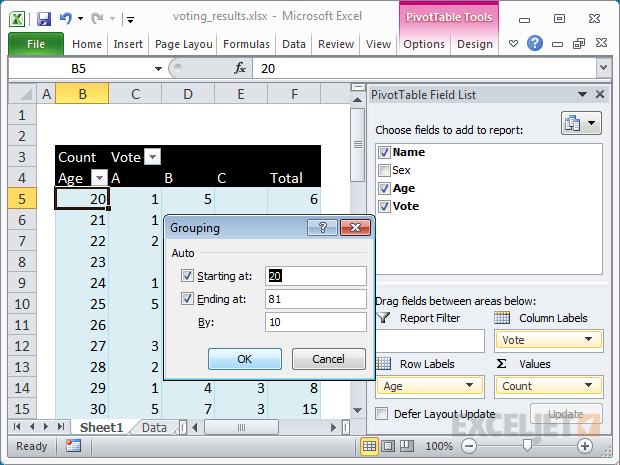
Although this pivot table is interesting, it’s not very useful, since the automatic grouping by actual age is too granular. We don't care that five 20-year-olds voted for Option B – we want to see voting results by age ranges, like 20-29, 30-39, etc. This is easily done using the grouping feature built in to pivot tables. To group results by age, right-click any value in the Age field and choose Group from the menu.
Specifying the interval
When the Grouping dialog box appears, enter any interval that makes sense in the “By:” input area. For this example, we’ll group by 10 years.
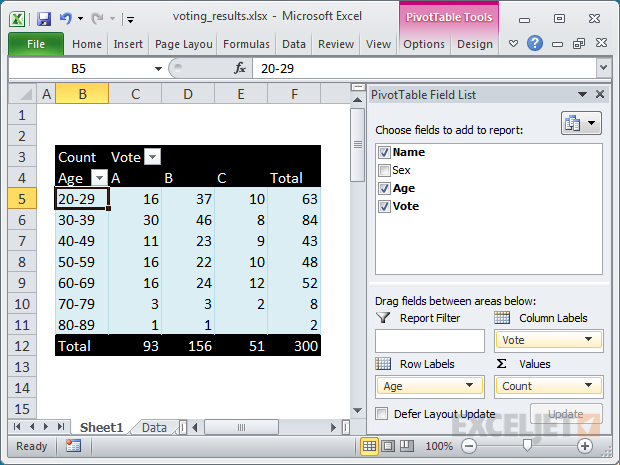
The final result
When you click OK, you’ll see your data neatly grouped by age at 10 year intervals.
You can use this same approach to group numeric data in many useful ways. You can group customers by total sales, group employees by their time at a company, group weather data by temperature – the list is endless.
Learning pivot tables
Pivot tables are easy to create but hard to control. Our short video course, Core Pivot, walks you step-by-step through the most important features of Pivot Tables.


