
Purpose
Calculate modified internal rate of return
Return value
Calculated return as percentage
Syntax
=MIRR(values, finance_rate, reinvest_rate)- values - Array or reference to cells that contain cash flows.
- finance_rate - Required rate of return (discount rate) as percentage.
- reinvest_rate - Interest rate received on cash flows reinvested as percentage.
Microsoft docs
Using the MIRR function
The standard Internal rate of return function (IRR) assumes all cash flows are reinvested at the same rate as the IRR. The modified internal rate of return function (MIRR) accepts both the cost of investment (discount rate) and a reinvestment rate for cash flows received.
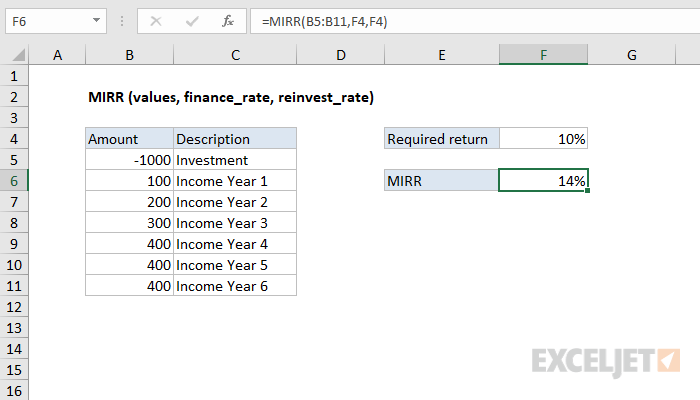
In the example shown, the formula in F6 is:
=MIRR(B5:B11,F4,F4)
In this example, we assume that the reinvestment rate is the same as the cost of capital, so we set both the finance_rate and reinvest_rate to the value in F4, which is 10%.
Notes
- The values array must contain at least one positive value and one negative value.
- Values should be in chronological order.
- MIRR assumes cash flows at regular periods.