Summary
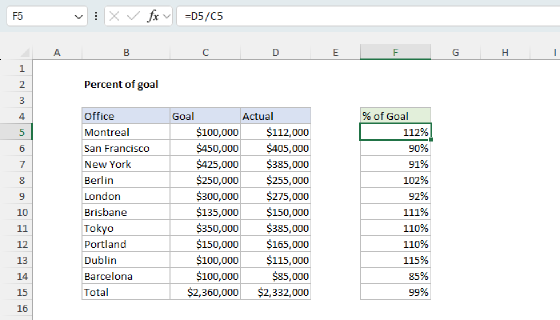
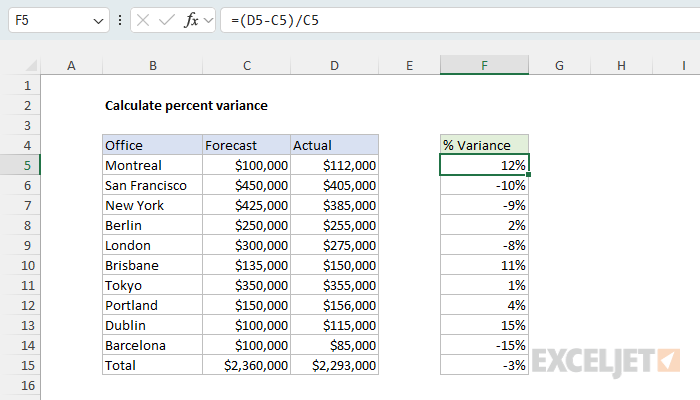
To calculate a percent variance (also called percent change), subtract the original (baseline) number from the new number, then divide that result by the original. In the example shown, the formula in F5, copied down, is:
=(D5-C5)/C5
The results in column F are decimal values with the percentage number format applied. The same formula can be used to calculate things like percent change between this year and last year, variance between a budget and actual values, and so on.
This page is about variance as a percentage. For variance in the statistical sense, a measure of how spread out a set of numbers is, see the VAR.S function.
Generic formula
=(new-baseline)/baseline
Explanation
In this example, the goal is to calculate the variance between a Forecast (column C) and Actual (column D) as a percentage. For example, with a Forecast value of 100,000 and an Actual value of 112,000, we want to return a variance of 12%.
The percent change formula
The concept of variance requires a baseline value and a "new" value. The baseline value is subtracted from the new value and the result is divided by the baseline value. The general formula, where "x" is the variance, is:
x=(new-baseline)/baseline
x=(112,000-100,000)/100,000
x=12,000/100,000
x=0.12
After converting to an Excel formula with cell references, the formula in F5, copied down, is:
=(D5-C5)/C5
=(112000-100000)/100000
=12000/100000
=0.12
The parentheses matter: they make Excel subtract before it divides. As the formula is copied down, it returns a decimal number for each item in the list. When these numbers are formatted with the Percentage number format, they are displayed as percentages. A positive result is an increase, and a negative result is a decrease: in San Francisco, the actual is 10% below the forecast.
This is the same formula you use for any percent change: from last month to this month, from last year to this year, or from an old price to a new one. The baseline (the "old" value) always goes in the denominator. You will also see the formula written like this, which returns the same result:
=D5/C5-1
Negative numbers
If the original number is negative, the formula above returns a result with the wrong sign. In the worksheet below, the goal is to calculate the change in profit from last year to this year, and three regions had a loss last year:
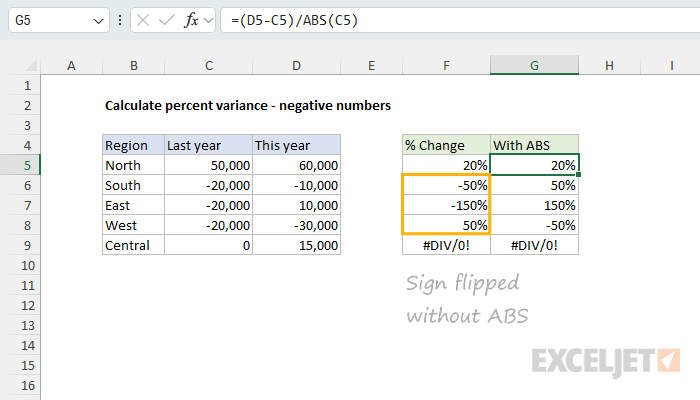
In row 6, South's loss shrank from -20,000 to -10,000, an improvement, but the formula in F6 returns -50%. This happens because dividing by a negative number flips the sign. To fix the problem, add the ABS function to the denominator. The formula in G5, copied down, is:
=(D5-C5)/ABS(C5)
ABS stands for "absolute value", and it converts negative values to positive values. In this case, the ABS function ensures the original value is positive when the variance is calculated, so South shows a 50% improvement, and West, whose loss grew from -20,000 to -30,000, shows -50%.
Note: be aware that results with negative values can be misleading, as explained by Jon Acampora in his detailed article on the topic.
When the original number is zero, percent change is undefined, and both formulas return #DIV/0! (row 9). To return an empty string instead, test the original first:
=IF(C5=0,"",(D5-C5)/ABS(C5)).
Percent difference
Percent change has a direction: it measures from a baseline to a new value. When neither number is the baseline, for example the price of the same item at two stores, you may want percent difference instead, which compares the difference to the average of the two numbers. The formula in F5, copied down, is:
=ABS(C5-D5)/AVERAGE(C5,D5)
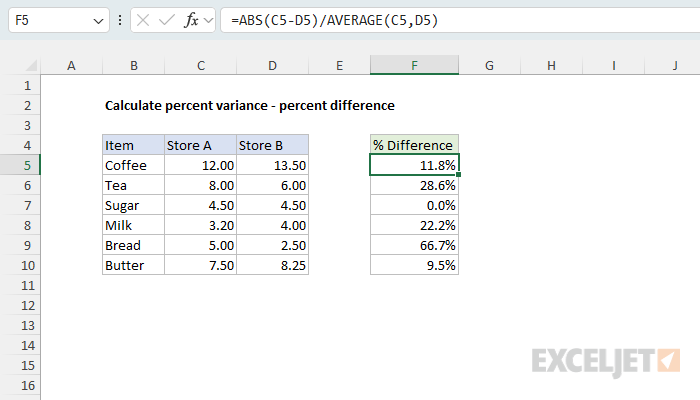
In row 5, coffee costs 12.00 at Store A and 13.50 at Store B. The difference is 1.50 and the average is 12.75, so the percent difference is about 11.8%. Percent change would give a different answer depending on which store is the baseline: 12.5% from A to B, and -11.1% from B to A. Percent difference returns the same result either way, and because of ABS, it is never negative.