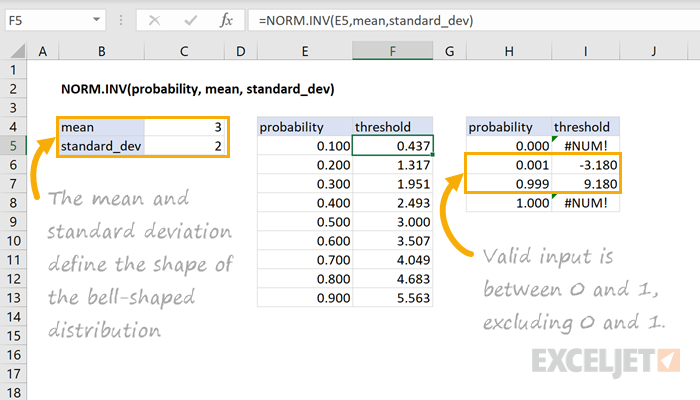
=NORM.INV(probability, mean, standard_dev)- probability - The probability of an event occurring below a threshold.
- mean - The mean of the distribution.
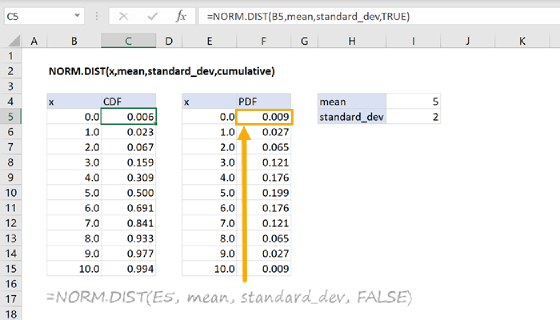
- standard_dev - The standard deviation of the distribution.
Using the NORM.INV function
The NORM.INV function returns the inverse of the normal cumulative distribution. Given the probability of an event occurring below a threshold value, the function returns the threshold value associated with the probability. For example, NORM.INV(0.5, 3, 2) returns 3 since the probability of an event occurring below the mean of the distribution is 0.5. Note, the area under a normal distribution within an interval corresponds to the probability of an event occurring within that interval.
=NORM.INV(0.5,3,2 )// Returns 3
Let's look at another example using the same normal distribution defined by a mean of 3 and standard deviation of 2.
=NORM.INV(0.84134,3,2)// Returns 5
In this case, the threshold corresponding to the probability of 0.84134 is equal to 5. In other words, the probability of an event occurring below 5 for this normal distribution is equal to 0.8413.
Notes
- The mean describes the center or "balancing point" of the normal distribution.
- The standard deviation describes the shape of the bell-shaped curve.
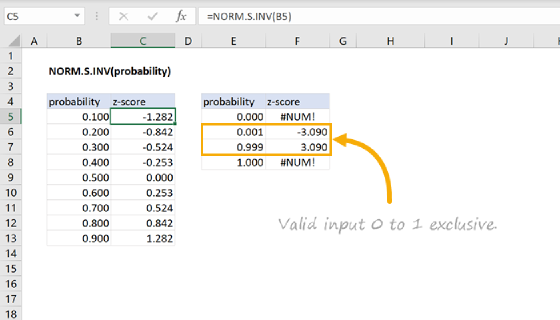
- Valid probability input to the function is within the range (0,1), excluding 0 and 1.